P019-E004 Moderate
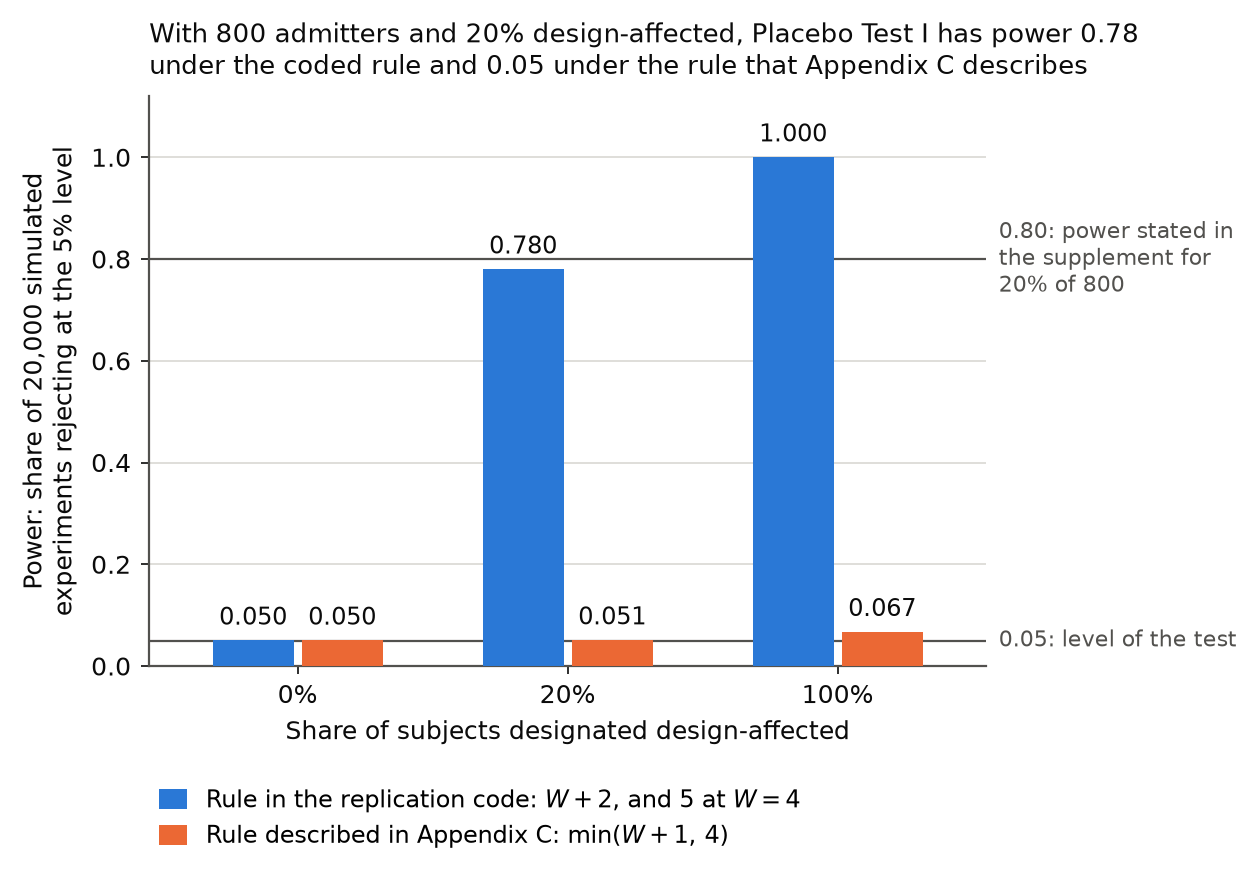
The simulated design effect is not the “ceiling effect” that Appendix C describes: the code adds the sensitive item after the capped increment, and against the rule as described Placebo Test I has power of about 0.05, not 0.80, with 800 admitters and 20% design-affected.
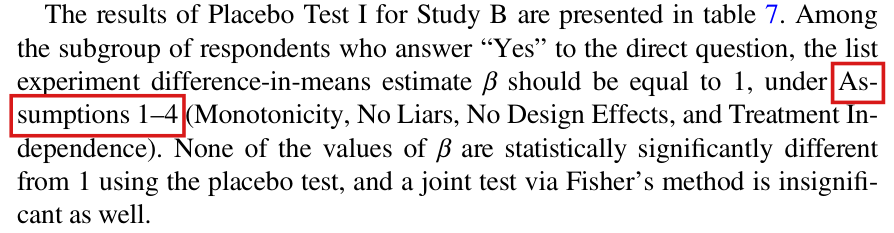
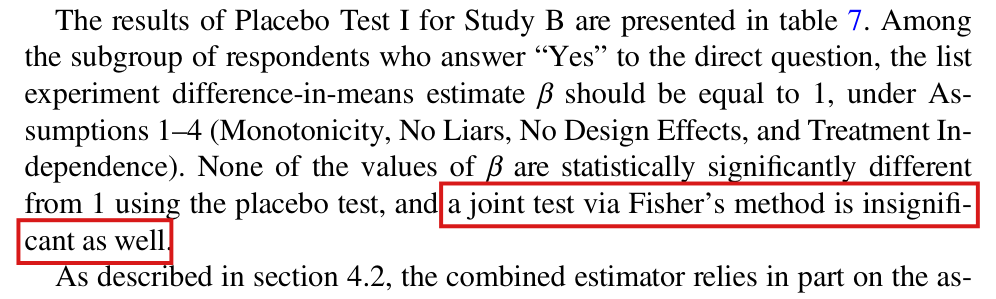
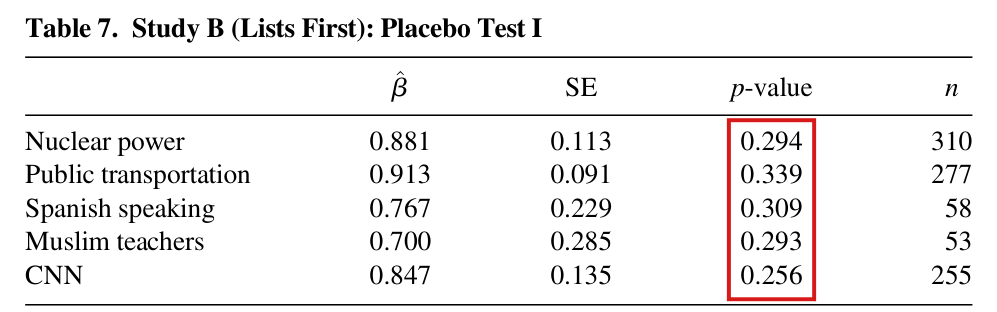
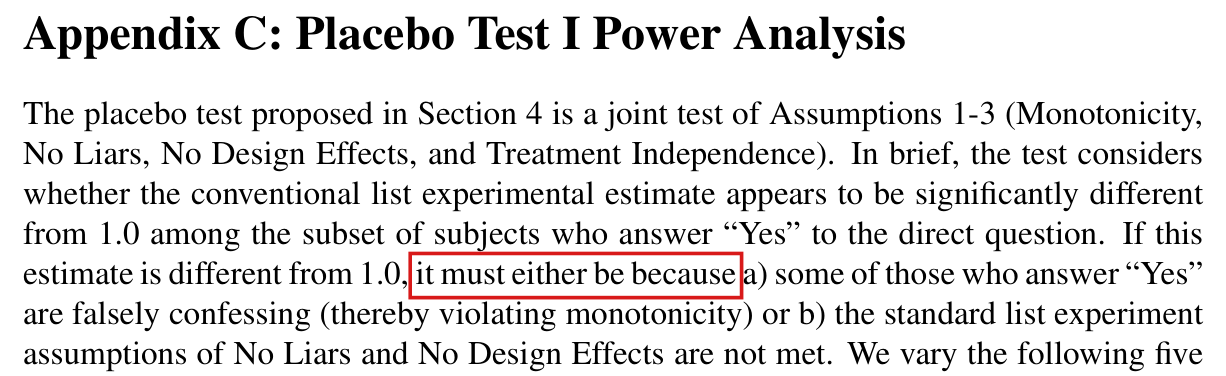
Online supplement, Appendix C, second paragraph and footnote 1, p. 2; the sentence on 80% power and Figure A1, lower-left panel, p. 3 (supplement PDF pp. 2–3). Replication files: ACCG_list_source.R, lines 82–86 and 103–106. The main text points to these results in Section 4.1, pp. 50–51 (PDF pp. 8–9)
See also under Formal statements (Lean): P019-T1, P019-T2, P019-T16
As printed
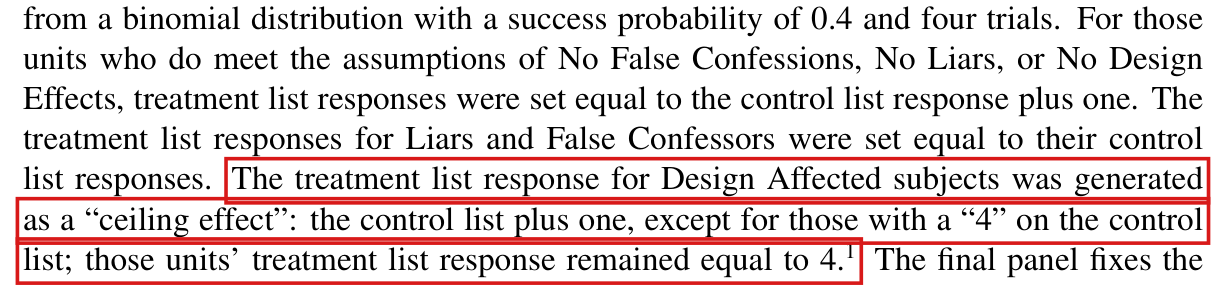
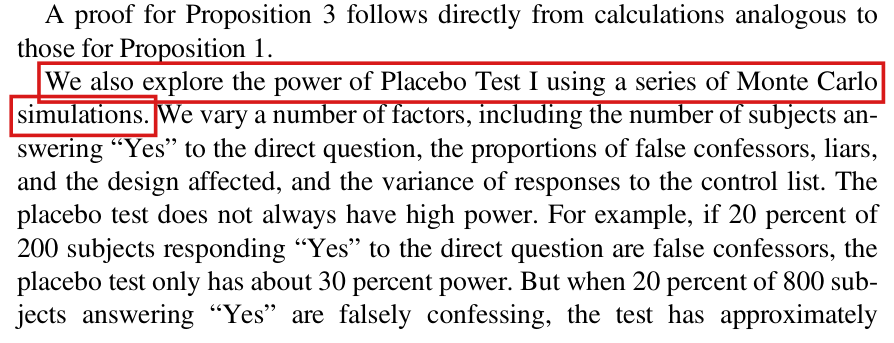
Supplement p. 2: “Control list responses were drawn from a binomial distribution with a success probability of 0.4 and four trials. For those units who do meet the assumptions of No False Confessions, No Liars, or No Design Effects, treatment list responses were set equal to the control list response plus one. The treatment list responses for Liars and False Confessors were set equal to their control list responses. The treatment list response for Design Affected subjects was generated as a “ceiling effect”: the control list plus one, except for those with a “4” on the control list; those units' treatment list response remained equal to 4.” Footnote 1, attached to this sentence: “This is one of many possible design effects; the power of our test to detect any particular design effect depends on the manner in which it changes subjects' treatment list responses.”
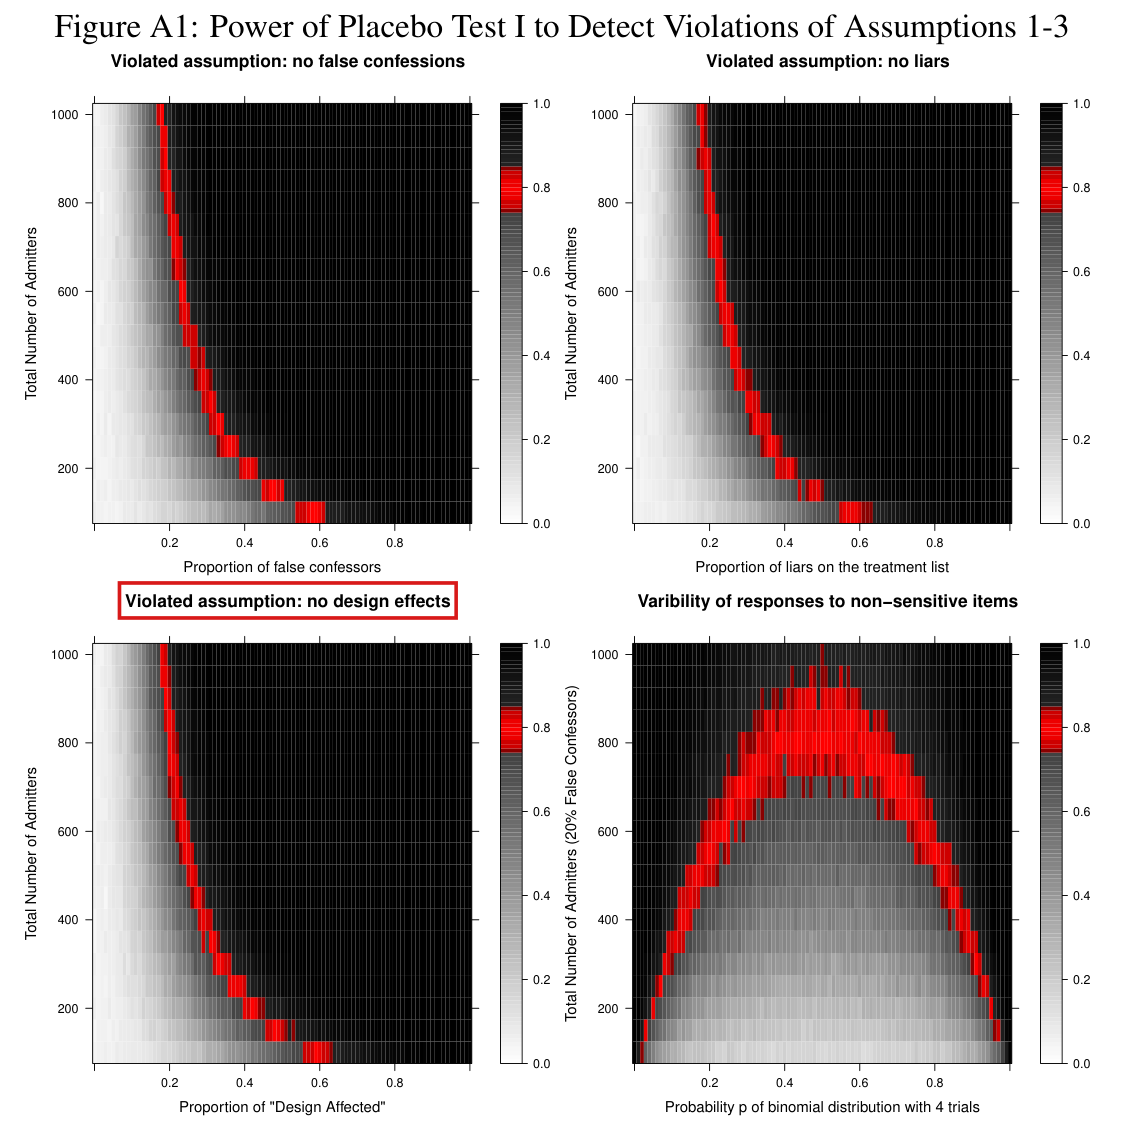
Supplement p. 3: “When approximately 20% of a sample of 800 confessors falsely confess, lie on the treatment list, or change their responses to the non-sensitive items on the treatment list, the placebo test achieves 80% power.” The lower-left panel of Figure A1 has the title “Violated assumption: no design effects”. Its horizontal axis is the proportion of “Design Affected”, and its vertical axis is the “Total Number of Admitters”.
In the file ACCG_list_source.R of the replication files, lines 83–85 are the body of the function design_affector, and lines 103–106 are in the function list_simulator:
x_star <- xx_star[x!=4] <- x[x!=4] + 1return(x_star)V0 <- rbinom(N, size=4, prob=baseline_binomial_prob)V1 <- V0+ Ystar*(1-listliar)V1[designaffected==1] <- design_affector(V0[designaffected==1]) +Ystar[designaffected==1]*(1-listliar[designaffected==1])
The problem
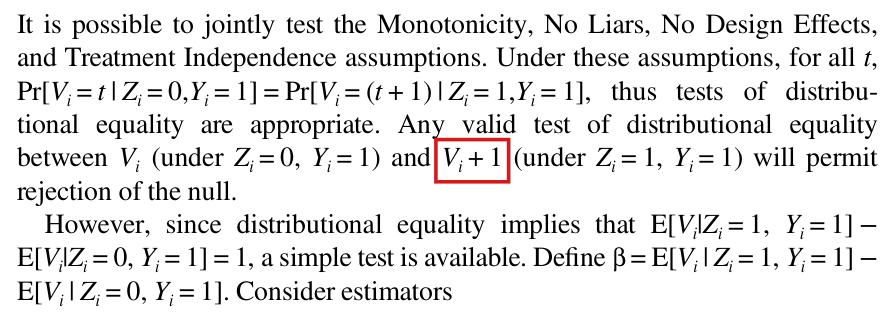
Appendix C says that the treatment-list response of a design-affected subject is the control-list response plus one, capped at four. I call this the described rule. I write for the control-list response, and I call a respondent who answers “Yes” to the direct question an admitter, as Figure A1 does. In the simulation for the lower-left panel of Figure A1, no admitter confesses falsely or lies on the list. For a design-affected admitter, the response under the described rule is , that is, for . The replication code does something else. The function design_affector raises the count of non-sensitive items by one unless it is already four, and the simulator then adds the sensitive item. I call this the coded rule. Under the coded rule the response is therefore , that is, . The two rules differ at every value of .
The two rules lead to different power. Placebo Test I tests whether the difference between the mean responses of the two arms among admitters equals 1. Under the described rule a design-affected admitter differs from an unaffected one only when , an event of probability . Then falls below 1 by times the affected share. Under the coded rule rises above 1 by times that share. The lower-left panel of Figure A1 and the last clause of the sentence on 80% power report high power. The coded rule has it and the described rule does not. With 800 admitters and 20% design-affected, the power is about 0.78 under the coded rule and about 0.05, the level of the test, under the described rule. Footnote 1 says that power depends on the form of the design effect. The statement of 80% power is then read as a statement about the rule just described. The evidence cannot decide which of the two the authors intended, the description or the code.
Evidence an exact counterexample
The evidence is an exact comparison of the two rules and a simulation of both with the authors' test function. Running the function design_affector unchanged and adding the sensitive item, I obtain the following responses.
| Not design-affected | Design-affected, described rule | Design-affected, coded rule | |
|---|---|---|---|
| 0 | 1 | 1 | 2 |
| 1 | 2 | 2 | 3 |
| 2 | 3 | 3 | 4 |
| 3 | 4 | 4 | 5 |
| 4 | 5 | 4 | 5 |
The control-list response is binomial with four trials and success probability , and the values have probabilities , , , and . Let indicate a design-affected subject, and let be the share of such subjects, who are drawn at random independently of and of the treatment. The treatment-list response of an admitter is under the described rule and under the coded rule. Taking expectations, I obtain
At these values are and .
The simulation follows the script for the panel: the stated number of admitters, 200 withholders and 200 respondents who do not engage in the behavior, with the specified share of all subjects designated design-affected. Both rules are applied to the same draws, the test is the authors' placeboI_test, and the null is rejected when .
| Admitters | Share design-affected | Described rule | Coded rule |
|---|---|---|---|
| 800 | 0 | 0.05015 (0.00154) | 0.05015 (0.00154) |
| 800 | 0.20 | 0.05070 (0.00155) | 0.77965 (0.00293) |
| 800 | 1 | 0.06710 (0.00177) | 1.00000 |
| 1000 | 1 | 0.06950 (0.00180) | 1.00000 |
In the last two rows the coded rule led to rejection in all 20,000 experiments. In a second simulation, written independently and run with another seed, the power is 0.05145 and 0.77780 at 800 admitters and a share of 0.20. The full grid of Figure A1 was not computed again, and the values of its cells were not recovered. The simulation does not show that the power under the described rule stays near 0.05 in arbitrarily large samples, since differs from 1 whenever .
What survives
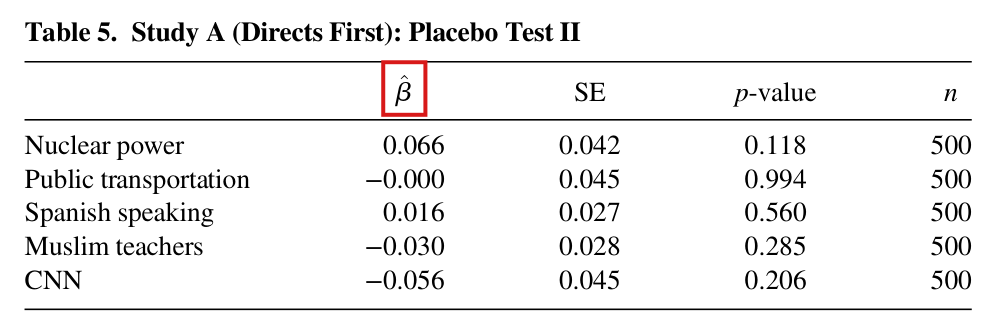
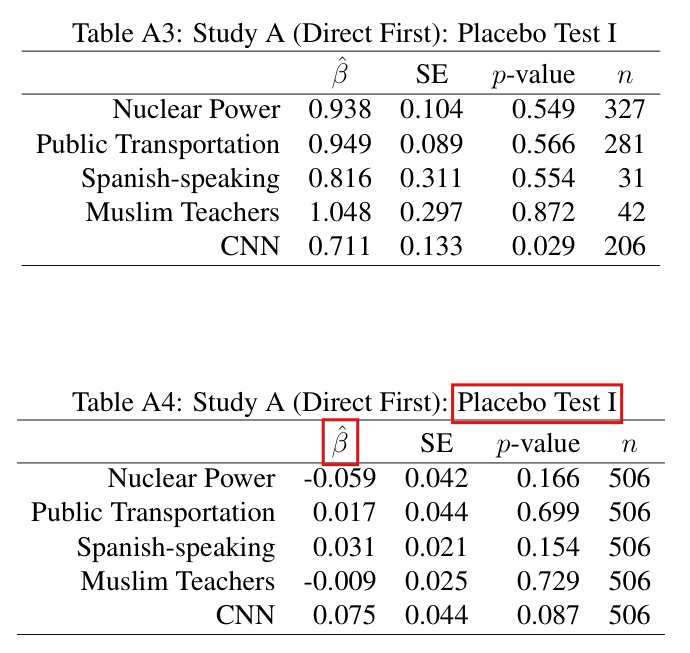
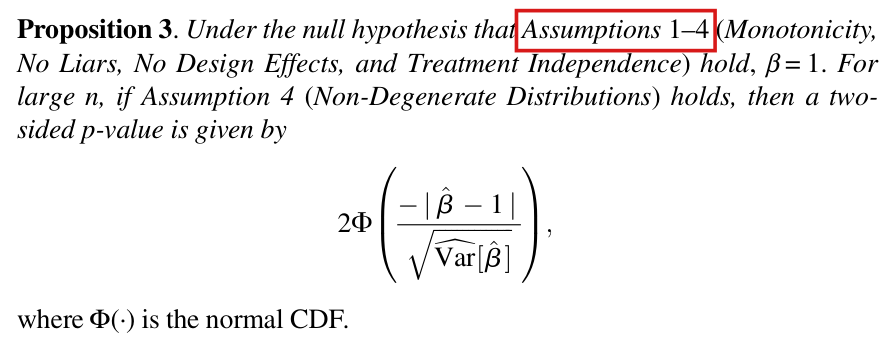
The defect is confined to three places: the description of the design effect in Appendix C, the reading of the lower-left panel of Figure A1 as that design effect, and the last clause of the sentence on 80% power. The example in the main text, with about 80 percent power when 20 percent of 800 are false confessors, concerns false confessions and is not affected. The test formula of Proposition 3, the identification and efficiency results, the other panels of Figure A1, Placebo Test II, and the estimates and placebo p-values of the application do not depend on the simulated design effect. The high-power conclusion does not hold for the printed ceiling rule. Either the statement of 80% power is attached to the positive design effect that was simulated, or the ceiling rule is kept and the panel shows power near the level of the test at the point that the text cites.
Corrected
Supplement p. 2: “The treatment list response for Design Affected subjects was generated by raising the response to the non-sensitive items by one, except for those with a “4” on the control list, and then adding the sensitive item. For subjects who engage in the behavior and do not lie on the list, the treatment list response is therefore the control list response plus two, or 5 for those with a “4” on the control list.”
Supplement p. 3: “When approximately 20% of a sample of 800 confessors falsely confess, lie on the treatment list, or report one more non-sensitive item on the treatment list unless they already report all four, as described above, the placebo test achieves about 80% power.”
If the ceiling rule of the printed text is kept instead, the code should set the treatment-list response of a design-affected admitter to with no further addition, the lower-left panel should be computed again, and the text should say that against this design effect the test has power of about 0.05 with 800 admitters and 20% design-affected.