Assumptions and verification
Claim revision: catalog:933978dd7a738add431b6776e8ab4be1535c8357d5c1a7523acb8a3aff19e93b
Standing assumptions: The article (The ANNALS of the American Academy of Political and Social Science 667, September 2016, pp. 126–142; printed page = PDF page + 125, so printed p. 126 is PDF p. 1) is an empirical report on the seventeen U.S. presidential elections from 1948 to 2012. It has no theorem, proposition, lemma or proof; its only displayed formula is the voter-centered extremism display on p. 133, and its other formulas are given in running text and in notes. Everything quoted below was read from the page images.
(S1) Outcomes. p. 128 (PDF p. 3): “The dependent variable in musical chairs is incumbent party vote margin, in percentage points, in the U.S. presidential elections from 1952 to 2012. Third-party votes are implicitly included in this measure, which is calculated as (incumbent party percent of the vote) − (challenging party percent of the vote).” p. 129 (PDF p. 4): “The dependent variable in bread and peace is the incumbent party’s share of the two-party vote in the presidential elections from 1952 to 2012. The measure is calculated as: 100*(incumbent votes / (incumbent + challenger votes)).”
(S2) The discounted income variable of bread and peace. p. 128 (PDF p. 3): “While Hibbs, like Achen and Bartels (2016), also employs change in RDI to measure economic performance, bread and peace allows RDI growth from every quarter of a presidential term to factor into the model, albeit discounted over time so that earlier quarters carry less weight. Hibbs applies a decay parameter—$\lambda$, estimated within the model as a number between 0 and 1—to progressively discount economic growth in earlier quarters of the presidential term. This discounting takes the following form: Because the election is held one-third of the way through the 16th quarter of a presidential term, RDI growth in this quarter is down-weighted by $\tfrac13 * \lambda^0$. The 15th quarter of the presidential term is down-weighted by $\lambda^1$, the 14th quarter by $\lambda^2$, and so on for the preceding quarters. The closer the estimate of $\lambda$ is to 1, the smaller the time decay, so that if $\lambda = 1$, economic growth in earlier quarters would matter just as much as economic growth immediately before the election; the closer the estimate of $\lambda$ is to 0, the greater the time decay.$^{5,6}$ Bread and peace consistently estimates $\lambda$ to be about .9, making the voter’s economic memory very long, as opposed to the short-term memory seen in musical chairs.” Note 5, p. 141 (PDF p. 16): “5. This is because $1^{15} = 1^{14} = \ldots = 1^0 = 1$, so all quarters receive an equal weight of 1; and $0^{15} = 0^{14} = \ldots = 0^1 = 0$, but $0^0 = 1$, so all quarters preceding the election quarter receive a weight of 0.” Note 6, p. 141: “6. For comparison, musical chairs could be thought of as having a decay parameter of $\lambda = 1$ for the 14th and 15th quarter, and $\lambda = 0$ for all other quarters.” The paper prints no formula for the variable as a whole and no normalizing denominator.
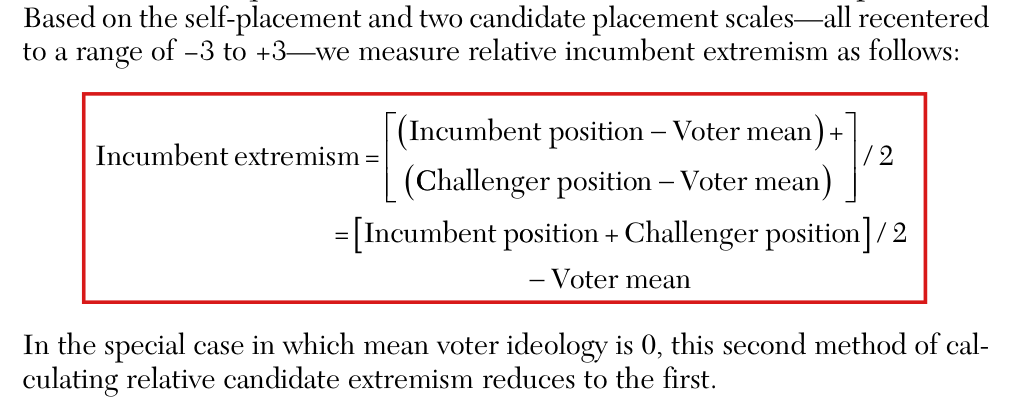
(S3) Relative candidate extremism. First method, p. 132 (PDF p. 7): “On both the ANES/Rosenstone and the NOMINATE measures of ideological location, liberal positions are scored as negative and conservative positions are scored as positive. […] To do this, we first transform our scale so that positive numbers represent incumbent-party candidates’ ideology (rather than conservative candidates’ ideology), and negative numbers represent challenging-party candidates’ ideology (rather than liberal candidates’ ideology).$^{11}$ Then we take the midpoint between each set of opposing candidates to arrive at a single relative candidate extremism score for each election. With this transformed scale, positive values of our relative candidate extremism variable indicate that the incumbent-party candidate is more extreme than the challenger; negative values indicate that the challenger is more extreme than the incumbent.” (the last sentence runs on to p. 133). Note 11, p. 141 (PDF p. 16): “11. This simply involves taking the absolute value of every candidate’s ideological location score and then multiplying challenging-party candidates’ scores by −1.” Second method, p. 133 (PDF p. 8): “Based on the self-placement and two candidate placement scales—all recentered to a range of −3 to +3—we measure relative incumbent extremism as follows: $$\text{Incumbent extremism} = \left[\begin{array}{l}(\text{Incumbent position} - \text{Voter mean}) + \\ (\text{Challenger position} - \text{Voter mean})\end{array}\right] / 2 = [\text{Incumbent position} + \text{Challenger position}] / 2 - \text{Voter mean}$$ In the special case in which mean voter ideology is 0, this second method of calculating relative candidate extremism reduces to the first.” Five measures, pp. 133–134 (PDF pp. 8–9): “From the ANES data, we can calculate zero-centered and voter-centered relative candidate extremism measures for elections from 1972 to 2012. We can also calculate a zero-centered measure of relative NOMINATE extremism, but lacking a measure of voter location on the NOMINATE scale, we cannot build a voter-centered NOMINATE measure. We thus arrive at five measures of relative incumbent extremism, each of which can be tested in the musical chairs and bread and peace models. […] In testing five measures in each of the two models, we have a total of ten tests of voter sensitivity to extreme candidates in presidential elections.” [The display is the subject of clarity note P039-A001 and is not a target. The score that was computed, and that the targets use, is $(|x_I - m| - |x_C - m|)/2$, where $x_I$ and $x_C$ are the locations of the incumbent-party and challenging-party candidates on the liberal-negative, conservative-positive scale and $m$ is the reference point, 0 or the mean voter self-placement (deposited script 3).]
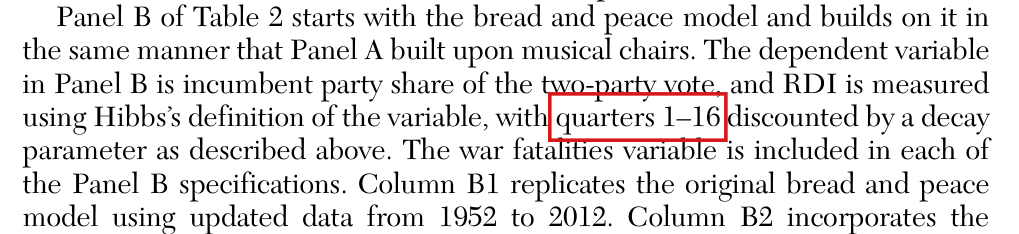
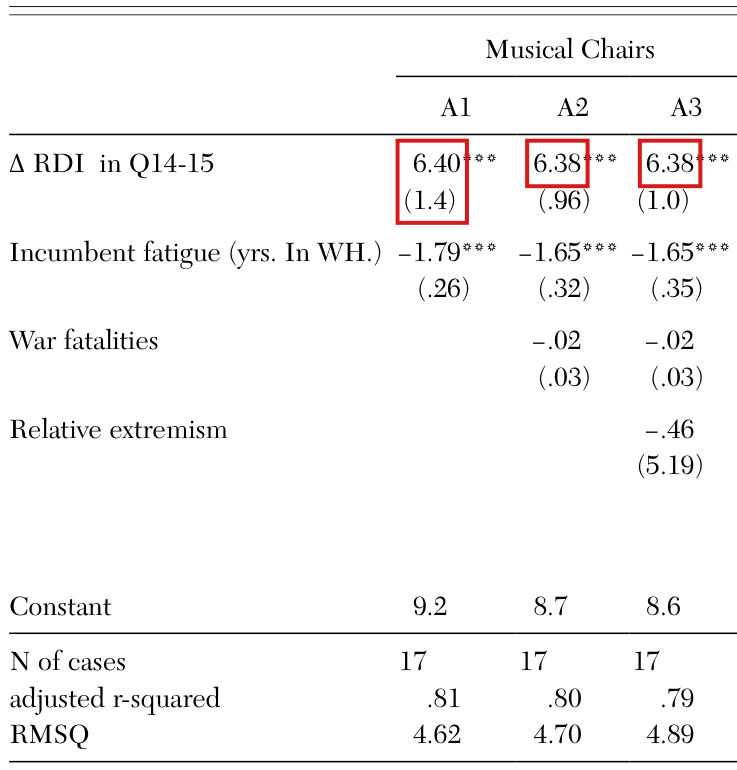
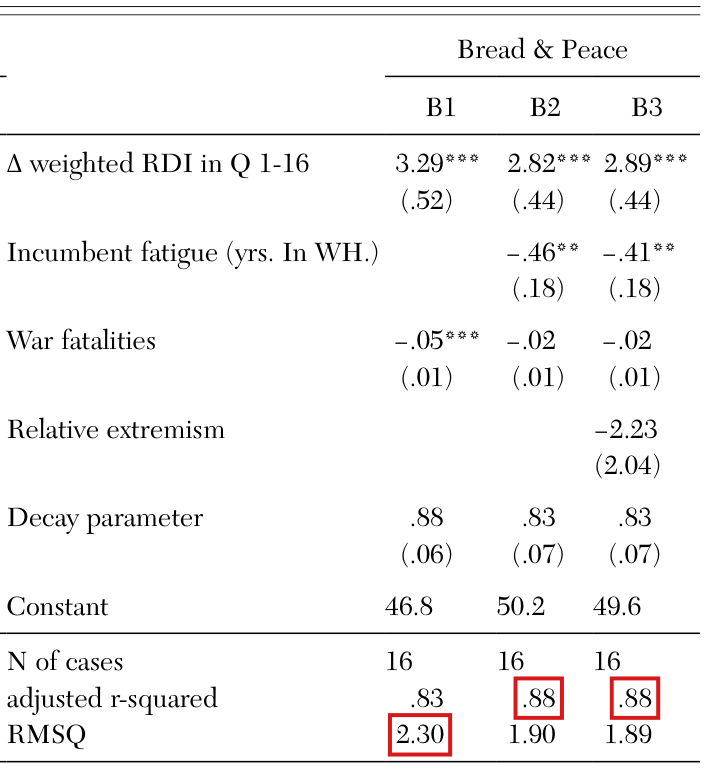
(S4) The six specifications of Table 2. p. 136 (PDF p. 11): “Panel A of Table 2 uses the musical chairs model as a starting point. The dependent variable is incumbent party vote margin, and RDI is measured using the musical chairs version of the variable: change in RDI per capita immediately prior to the election (quarters 14 and 15). Incumbent party fatigue, measured by the number of years the incumbent party has spent in the White House, is also included in each of the specifications in Panel A. Column A1 replicates the original musical chairs model, with updated data from 1948 to 2012. Column A2 creates a composite model by introducing the war fatalities variable from bread and peace into the original musical chairs model. In column A3, we add our main incumbent party relative candidate extremism variable (the zero-centered, refined ANES/Rosenstone measure) to the composite model built in column A2.” “Panel B of Table 2 starts with the bread and peace model and builds on it in the same manner that Panel A built upon musical chairs. The dependent variable in Panel B is incumbent party share of the two-party vote, and RDI is measured using Hibbs’s definition of the variable, with quarters 1–16 discounted by a decay parameter as described above. The war fatalities variable is included in each of the Panel B specifications. Column B1 replicates the original bread and peace model using updated data from 1952 to 2012. Column B2 incorporates the incumbent fatigue variable from musical chairs to create a composite based on the bread and peace model. Column B3 then adds our main extremism variable to the composite model from column B2.”
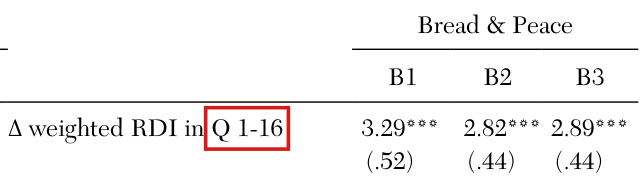
Table 2, “Relative Extremism Variable in Baseline Models”, p. 137 (PDF p. 12; printed sideways), as printed, each coefficient followed by its parenthesized entry. Musical Chairs, columns A1 | A2 | A3: “∆ RDI in Q14-15”: 6.40*** (1.4) | 6.38*** (.96) | 6.38*** (1.0). “Incumbent fatigue (yrs. In WH.)”: −1.79*** (.26) | −1.65*** (.32) | −1.65*** (.35). “War fatalities”: blank | −.02 (.03) | −.02 (.03). “Relative extremism”: blank | blank | −.46 (5.19). “Constant”: 9.2 | 8.7 | 8.6. “N of cases”: 17 | 17 | 17. “adjusted r-squared”: .81 | .80 | .79. “RMSQ”: 4.62 | 4.70 | 4.89. Bread & Peace, columns B1 | B2 | B3: “∆ weighted RDI in Q 1-16”: 3.29*** (.52) | 2.82*** (.44) | 2.89*** (.44). “Incumbent fatigue (yrs. In WH.)”: blank | −.46** (.18) | −.41** (.18). “War fatalities”: −.05*** (.01) | −.02 (.01) | −.02 (.01). “Relative extremism”: blank | blank | −2.23 (2.04). “Decay parameter”: .88 (.06) | .83 (.07) | .83 (.07). “Constant”: 46.8 | 50.2 | 49.6. “N of cases”: 16 | 16 | 16. “adjusted r-squared”: .83 | .88 | .88. “RMSQ”: 2.30 | 1.90 | 1.89. “NOTE: Dependent variable for musical chairs is incumbent vote margin. Dependent variable for bread and peace is incumbent vote share. RDI = real disposable income; WH = White House; RMSQ = Root mean squared error. ***$p$ < .01. **$p$ < .05. *$p$ < .10.”
(S5) Residual plots. p. 138 (PDF p. 13): “The residuals from the composite models in columns A2 and B2 represent the variation in vote outcomes that remains unexplained by the three fundamental variables: change in RDI, incumbent fatigue, and war fatalities. Figure 4 plots the residuals from these two composite models against our main relative extremism variable. This provides a picture of how much of the unexplained variance in vote outcomes might be explained by candidate extremism.” Figure 4, “Additional Explanatory Force of Relative Candidate Extremism” (p. 138): two panels, “Musical Chairs composite model” (vertical axis “Vote margin residuals”) and “Bread and Peace composite model” (vertical axis “Vote share residuals”), each plotting election labels against relative incumbent party candidate extremism on the horizontal axis, with a straight line drawn through the points.
(S6) Maximum effects. p. 139 (PDF p. 14): “Table 3 reports the maximum effect of candidate extremism that would be predicted by each of our ten models. All estimates are based on regressions identical in form to those in columns A3 and B3 in Table 2 and fully documented in our replication files. Maximum effect is calculated as the coefficient for the variable × the largest value of that variable.” Table 3, “Maximum Effect Sizes for All Models”, p. 139, as printed, each row giving Maximum effect, Two-tailed $p$-value, $df$ for Musical chairs and then for Bread and peace: “All-voter perception measures”, “(1) Zero-centered”: −0.43, 0.90, 12 | 1.24, 0.39, 10; “(2) Voter-centered”: 1.33, 0.60, 6 | 0.30, 0.85, 5; “Refined voter perception measures”, “(3) Zero-centered”: 0.29, 0.93, 12 | 1.38, 0.30, 10; “(4) Voter-centered”: 2.28, 0.42, 6 | 0.82, 0.64, 5; “(5) NOMINATE locations”: −2.53, 0.69, 3 | 1.14, 0.77, 2.
(S7) Not in the paper. The paper does not say how the models are estimated, does not say what the parenthesized entries of Table 2 are, prints no formula for the weighted income variable and prints no election-level data. These are taken from the deposited replication files (Yale Dataverse 10.60600/YU/PPBAY4, V1.1; staged under staged/code/yale-dataverse-PPBAY4-v1.1/): script 5_Tables1-3_public.R fits Panel A by lm (ordinary least squares, lines 149, 154, 159) and Panel B and the bread and peace half of Table 3 by nls (nonlinear least squares, lines 236, 242, 247, 321, 332, 343, 354, 365); script 6_Figures1-4_public.R draws each line of Figure 4 by lm(resid(file) ~ extremism) (lines 162 and 194); the relative-extremism scores are in ideology_scores_IncPtyCandRelXtrm.csv and ideology_scores_IPCRE-NOMINATE.csv and the regression inputs in data_fig3&4.csv. Where a target uses deposited numbers, each decimal string is taken as the exact rational it denotes, and the numbers are taken as given: no target concerns how the data were constructed. The online appendix cited in note 7 is not staged.
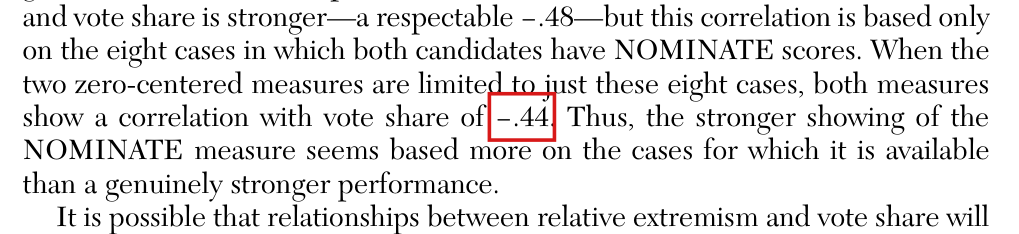
Scope of the targets. None of the headline claims P039-H1 to P039-H8 is a mathematical statement (each is an empirical estimate or an interpretive conclusion), so there is no headline_result target. No finding is rated above Minor (nine confirmed errors, all Minor), so there is no result_touched_by_finding target and every target has priority 3. The seven targets come from the four confirmed errors whose correction changes mathematical content: P039-E001 (the quarter range and exponent range of the discounted income variable: a formula described with sixteen terms and fitted with fifteen, with an exact witness), P039-E002 (a significance statement read off a regression of residuals: an inferential claim that rests on an exact linear counterexample), P039-E004 (the rule “coefficient × the largest value” and the election that note 15 says it selects: the rule as worded and its stated outcome both fail on the deposited scores) and P039-E003 (a standard error in Table 2 that is arithmetically incompatible with the neighbouring printed entries). The other confirmed errors are not targets because their corrections change no mathematical statement. P039-N006 (one in-text correlation, −.44 for −.45), P039-N008 (three fit statistics in Table 2, Panel B, off by one in the last digit) and P039-N010 (two candidate locations in the worked example of p. 139, 1.58 and −.34 for 1.57 and −.33) are recalculations of reported numbers from the deposited data; the arithmetic of the worked example, $(|-.34| - |1.58|)/2 = -.62$ and $-2.23 \times (-.62) = 1.3826$, holds for the printed pair, and $(|-.33| - |1.57|)/2 = -.62$ for the corrected pair. P039-E008 and P039-N013 are bibliographic. Findings classed as clarity notes (P039-E005, P039-E006, P039-A001, P039-N005), as not confirmed or as undetermined are outside the brief; two of them touch formulas quoted above (P039-E006: note 5’s “equal weight of 1” at $\lambda = 1$; P039-A001: the display on p. 133), and the targets below do not assert the wording those notes question.
Effective claim (source TeX): Exact refutation of the procedure (the validator's witness; not in the paper): the ordinary $t$ test of the slope in a regression of first-stage residuals on a raw regressor, referred to $n - 2$ degrees of freedom, is not the test of that regressor's coefficient in the model that also contains the first-stage regressors. On the same data the two tests can disagree at the 5% level, the two slopes can differ, and under the Gaussian null the residual-regression statistic does not have the $t_{n-2}$ distribution.
Setting (ordinary least squares, conventional standard errors). For a design matrix $A$ with $n$ rows and full column rank $p$ and a response $c \in \mathbb{R}^n$: $\hat\beta = (A^\top A)^{-1} A^\top c$, $\mathrm{SSE} = \|c - A\hat\beta\|^2$, degrees of freedom $n - p$, squared standard error of the last coefficient $\mathrm{SE}^2 = \frac{\mathrm{SSE}}{n-p}\,\big[(A^\top A)^{-1}\big]_{pp}$, and $t = \hat\beta_p / \mathrm{SE}$. Let $n = 6$, $\mathbf{1} = (1,1,1,1,1,1)^\top$, $u = (1,-1,0,0,0,0)^\top$, $v = (0,0,1,-1,0,0)^\top$, $w = (0,0,0,0,1,-1)^\top$; first-stage design $Z = [\mathbf{1}, u]$; $M = I - Z(Z^\top Z)^{-1} Z^\top$; outcome $y = u + \tfrac32 v + w = (1, -1, \tfrac32, -\tfrac32, 1, -1)^\top$; first-stage residual $r = My$.
(i) $Z^\top Z = \mathrm{diag}(6, 2)$, $M$ is symmetric and idempotent of rank 4, $r = \tfrac32 v + w = (0, 0, \tfrac32, -\tfrac32, 1, -1)^\top$ and $\|r\|^2 = \tfrac{13}{2}$.
(ii) [Same slope and same residuals, different tests] Take $x = v$. Residual regression (response $r$, design $[\mathbf{1}, x]$): coefficients $(0, \tfrac32)$, residual vector $w$, $\mathrm{SSE} = 2$, 4 degrees of freedom, $\mathrm{SE}^2 = \tfrac14$, $t^2 = 9$. Full regression (response $y$, design $[\mathbf{1}, u, x]$): coefficients $(0, 1, \tfrac32)$, residual vector $w$, $\mathrm{SSE} = 2$, 3 degrees of freedom, $\mathrm{SE}^2 = \tfrac13$, $t^2 = \tfrac{27}{4}$.
(iii) [The two tests disagree at the 5% level] For $t \ge 0$ the two-sided tail probability of Student's $t_4$ is $1 - \tfrac32 z + \tfrac12 z^3$ with $z = t/\sqrt{4 + t^2}$; at $t = 3$ it is $p_{\mathrm{res}} = 1 - \frac{45}{13\sqrt{13}}$, and $p_{\mathrm{res}} < \tfrac{1}{20}$ because $900 > 247\sqrt{13}$, that is $900^2 = 810000 > 793117 = 247^2 \cdot 13$. For $t \ge 0$ the two-sided tail probability of Student's $t_3$ is $1 - \frac{2}{\pi}\big(\arctan q + \frac{q}{1+q^2}\big)$ with $q = t/\sqrt{3}$; at $t = \tfrac{3\sqrt3}{2}$ (so $q = \tfrac32$, and $\arctan\tfrac32 = \tfrac{\pi}{4} + \arctan\tfrac15$) it is $p_{\mathrm{full}} = \tfrac12 - \frac{2}{\pi}\big(\arctan\tfrac15 + \tfrac{6}{13}\big)$, and $p_{\mathrm{full}} > \tfrac12 - \tfrac23\big(\tfrac15 + \tfrac{6}{13}\big) = \tfrac{23}{390} > \tfrac{1}{20}$ because $\arctan\tfrac15 < \tfrac15$ and $\pi > 3$. So the test of the line through the residuals rejects at the 5% level and the test of the coefficient in the full model does not ($p_{\mathrm{res}} \approx .0399$, $p_{\mathrm{full}} \approx .0805$).
(iv) [The slopes differ when the raw regressor is correlated with a first-stage regressor] Take instead $x = u + v$, with the same $Z$, $y$ and $r$. Residual regression of $r$ on $[\mathbf{1}, x]$: slope $\tfrac34$, $\mathrm{SSE} = \tfrac{17}{4}$, $t^2 = \tfrac{36}{17}$ on 4 degrees of freedom. Full regression of $y$ on $[\mathbf{1}, u, x]$: coefficients $(0, -\tfrac12, \tfrac32)$, so the coefficient of $x$ is $\tfrac32$, with $\mathrm{SSE} = 2$ and $t^2 = \tfrac{27}{4}$ on 3 degrees of freedom. Here $x^\top M x = 2$, $x^\top x = 4$ and $\tfrac34 = \tfrac32 \cdot \tfrac24$.
(v) [Wrong reference distribution under the null] Let $x = v$ and $y = Z\gamma + \varepsilon$ with $\gamma \in \mathbb{R}^2$ and $\varepsilon \sim N(0, \sigma^2 I_6)$, $\sigma > 0$. Then the residual-regression statistic is $T_{\mathrm{res}} = U/\sqrt{V/4}$, where $U = v^\top\varepsilon/(\sigma\sqrt2) \sim N(0,1)$ and $V \sim \chi^2_3$ is independent of $U$; that is, $T_{\mathrm{res}} = \sqrt{4/3}\;T$ with $T \sim t_3$. Hence $E[T_{\mathrm{res}}^2] = \tfrac43 \cdot 3 = 4$, whereas a $t_4$ variable has second moment $\tfrac{4}{4-2} = 2$: $T_{\mathrm{res}}$ is not $t_4$ distributed.
: SAP.P039.T3WholeStatement
Theorem: SAP.P039.T3
Statement hash: 0f3a5df1b63a9df43e4f9f354a195bfcaadc6a65450b9a70e1a0f6a3f82aceb0
Statement definition: SAP.P039.T3WholeStatement
Certificate. 20261104T174956Z
Declaration review: faithful; 2026-11-04T18:28:14Z; binding v2
Evidence scope: Certification checks formal proof objects. Statement fidelity is a model judgment. Author review is separate.
Proof dependencies: Independently extracted
Manifest annotation reconciliation: Effective use follows the source-bound dependency observation; original annotations are retained in the crosswalk.
AronowAudit.P039.gram_certificate_full_rank: observed used
AronowAudit.P039.normal_equation_expansion: observed used
AronowAudit.P039.normal_equation_unique: observed used
AronowAudit.P039.squaredLength_nonnegative: observed used
AronowAudit.P039.squaredLength_zero_iff: observed used
Source and evidence metadata · sap-2026-11-08-assured-release