P054-N001 Moderate
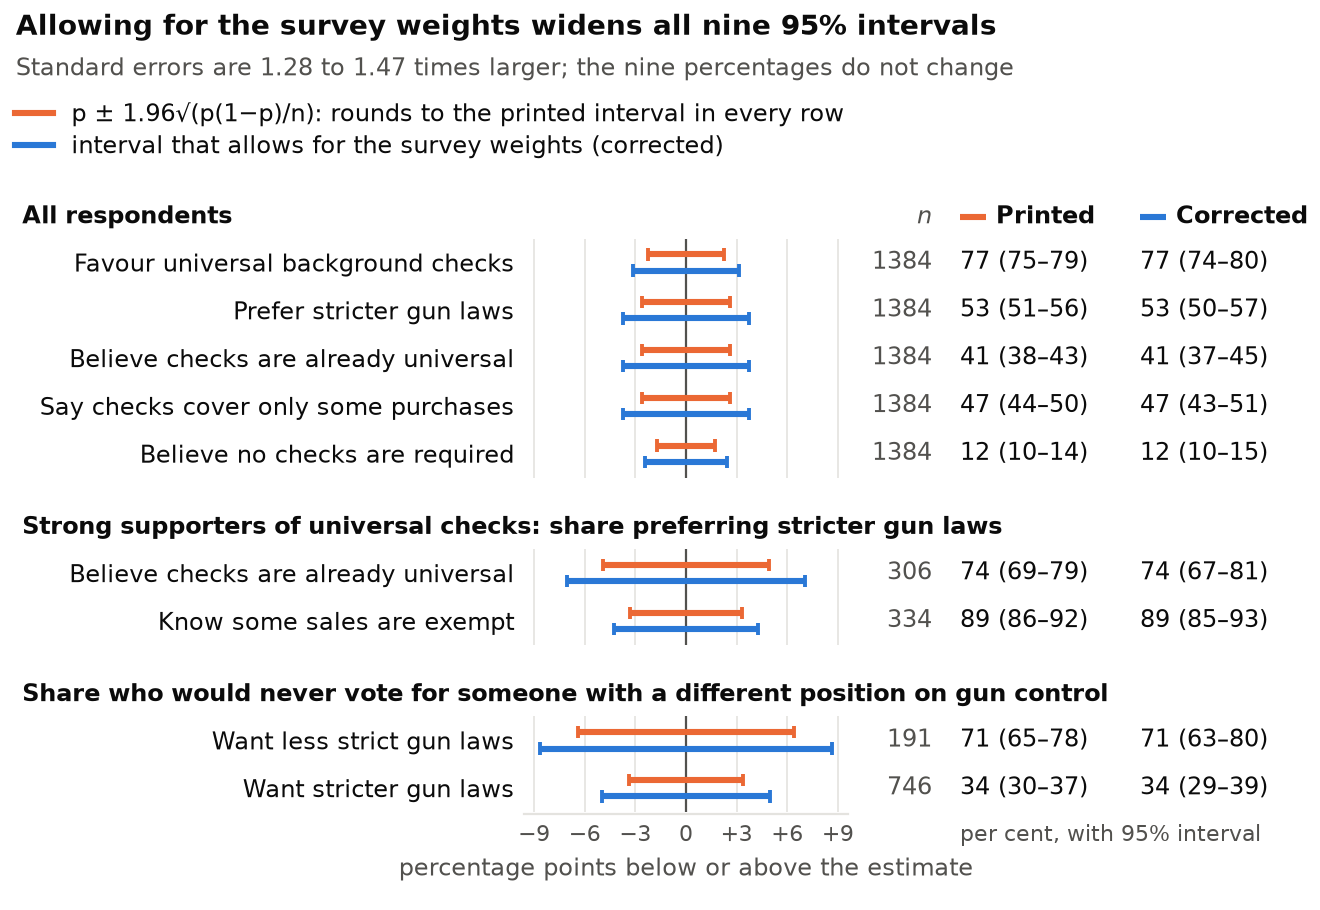
Under the stated independent-respondent survey linearisation, all nine intervals widen and the 53% stricter-law interval includes 50%; the nine estimates and the three main positive comparisons remain.
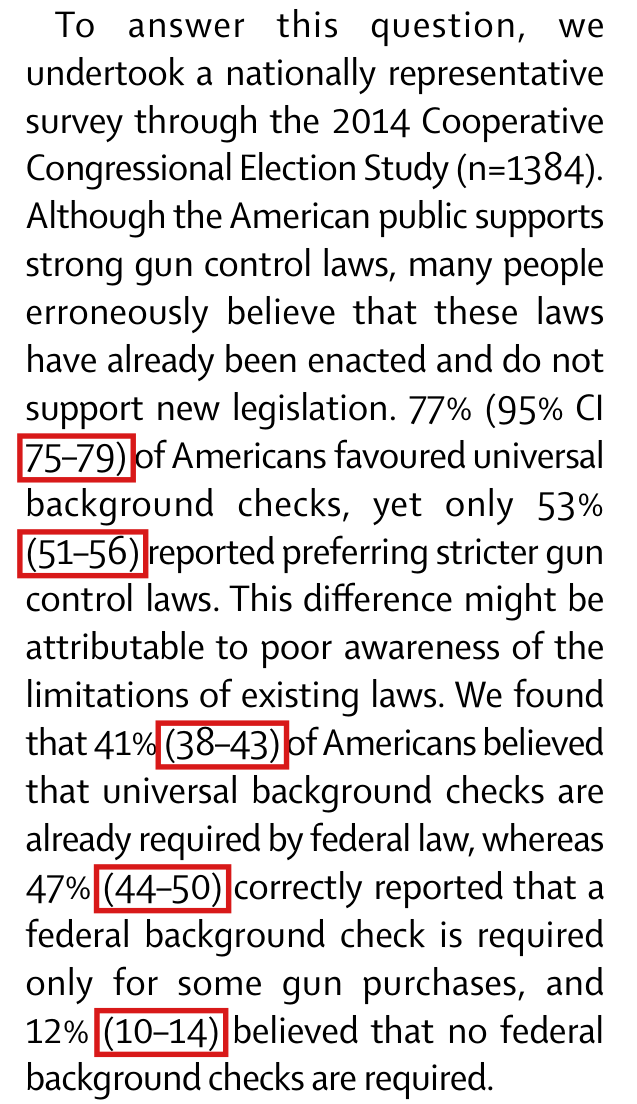
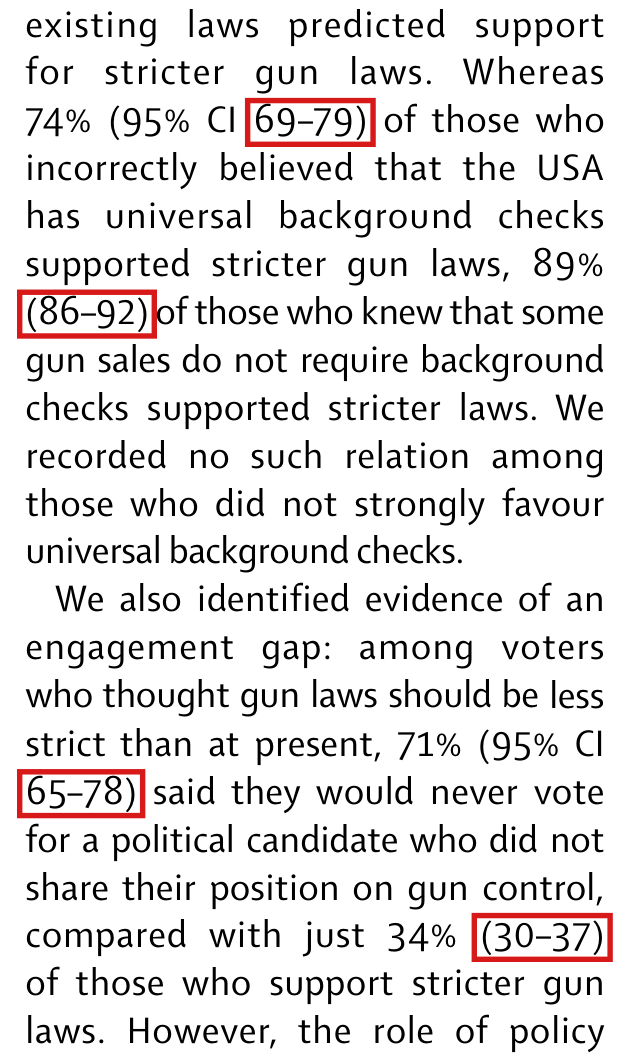
Columns 1 and 2, the nine percentages printed with 95% confidence intervals, from “77% (95% CI 75–79)” to “34% (30–37)”, p. 223 (PDF p. 1)
See also under Formal statements (Lean): P054-T1, P054-T2
I disputed this classification, but as a rule, deferred to the models’ final judgment: see my comment and the history of this entry.
As printed
To answer this question, we undertook a nationally representative survey through the 2014 Cooperative Congressional Election Study (n=1384). […] 77% (95% CI 75–79) of Americans favoured universal background checks, yet only 53% (51–56) reported preferring stricter gun control laws. […] We found that 41% (38–43) of Americans believed that universal background checks are already required by federal law, whereas 47% (44–50) correctly reported that a federal background check is required only for some gun purchases, and 12% (10–14) believed that no federal background checks are required.
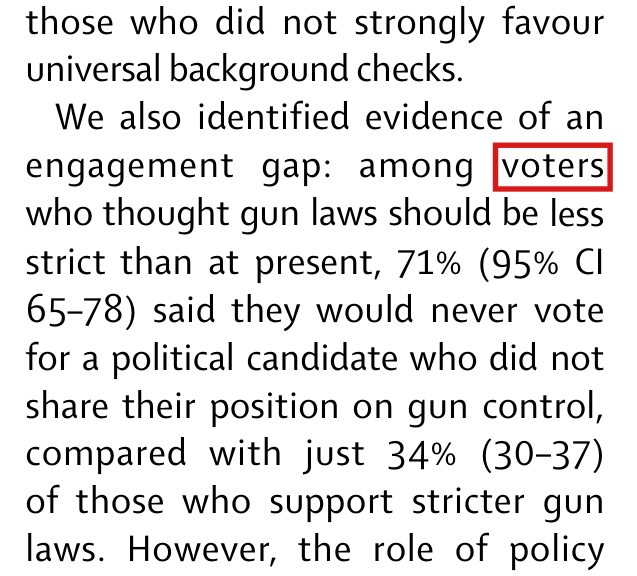
[…] Whereas 74% (95% CI 69–79) of those who incorrectly believed that the USA has universal background checks supported stricter gun laws, 89% (86–92) of those who knew that some gun sales do not require background checks supported stricter laws. […] 71% (95% CI 65–78) said they would never vote for a political candidate who did not share their position on gun control, compared with just 34% (30–37) of those who support stricter gun laws.
The problem
The letter states neither its weights, nor the rule that gives , nor how its intervals were computed. The public survey files reproduce all nine printed percentages and intervals under the reconstruction below. With the team weight of the February 2015 release, on the 1384 respondents with valid answers to the first three questions about guns, each of the nine percentages agrees with the print after rounding. Let be one of these weighted proportions and let be the unweighted number of respondents in its group. Then the interval rounds to the printed interval in all nine cases, at both endpoints.
This interval uses the weights in but does not account for their unequal influence in the variance. It treats as the proportion in a simple random sample of respondents with equal weights. The weights of the 1384 respondents are unequal: they range from to . The usual linearised variance of a weighted proportion, in the display under Evidence, allows for them. With , every standard error is larger, by a factor ranging from approximately to , and every interval is wider. For example, where the letter prints 74% (69–79), the interval becomes 74% (67–81). Under this approximation, the printed intervals overstate the precision of all nine estimates. No percentage changes.
Two limits apply. First, the rounded figures do not identify the original calculation uniquely. An actual intercept-only weighted least-squares fit in R, with classical standard errors and either normal or default critical values, also gives the same nine intervals after rounding, and six other rules for selecting respondents reproduce every printed percentage and interval. I report using classical intercept-only weighted least squares in R for the original analysis. That method is compatible with every printed number, while its historical use is not independently established by the letter, the available deposit or rounded agreement. Each matching calculation omits the squared-weight residual term from the survey-ratio variance, and under each of the seven rules none of the nine intervals based on the same linearisation rounds to the printed one. Second, is the ordinary approximation for independent respondents. Each release of the public files holds at most one weight and no strata, clusters or replicate weights, and the files do not document how the weight was built. The variance under the full design of the survey cannot be computed from them, and whether any of these intervals covers the national proportion 95% of the time is not established.
Evidence a recalculation from the source
I recalculated the nine estimates from the public survey files (2014 Cooperative Congressional Election Study, Yale team module, Harvard Dataverse, https://doi.org/10.7910/DVN/FBXY8V). Exact rational comparisons confirmed the rounded percentages and endpoints of both intervals in the table.
The following notation is introduced for the recalculation; the letter prints no formula. Fix one of the nine estimates. For respondent , let indicate that belongs to the group and gave a valid answer, let be the answer, and let be the weight. The sums below run over the respondents. Set , and , and define
The variance comes from linearising the ratio , where and . To first order, a change in changes the ratio by , so respondent enters through the residual . These residuals sum to zero. Their empirical variance is , and the estimated variance of their mean is . Dividing by gives . If all weights are equal, then , and equals up to the factor . The standard errors agree with those of the survey package of R for a design with independent respondents and these weights.
For an intercept-only weighted least-squares fit with classical standard errors, binary responses give
Thus entering the team weights in R’s lm leaves a classical intercept variance differing from only by the factor . Numerical agreement with the print establishes compatibility with the method I report using, not its historical use or the inverse-variance assumptions that would justify its classical SEs. Both matching formulas remain distinct from the survey-ratio variance .
The estimates are coded as follows. Favouring universal checks is the answer “strongly favor” or “favor”, and strong support is “strongly favor”. Preferring stricter laws is the answer “more strict” to the question with three answers. The last two estimates are the share answering “No” to the question whether one could still vote for someone standing for office with whom one disagrees on gun control. Respondents without a valid answer to it are left out.
| Printed | (%) | Rounded | ||||
|---|---|---|---|---|---|---|
| 77 (75–79) | 1384 | 76.82 | 74.60–79.05 | 73.68–79.97 | 74–80 | 1.41 |
| 53 (51–56) | 1384 | 53.24 | 50.61–55.87 | 49.51–56.96 | 50–57 | 1.42 |
| 41 (38–43) | 1384 | 40.82 | 38.23–43.41 | 37.08–44.56 | 37–45 | 1.44 |
| 47 (44–50) | 1384 | 47.05 | 44.42–49.68 | 43.34–50.76 | 43–51 | 1.41 |
| 12 (10–14) | 1384 | 12.13 | 10.41–13.85 | 9.67–14.58 | 10–15 | 1.43 |
| 74 (69–79) | 306 | 73.90 | 68.98–78.82 | 66.86–80.95 | 67–81 | 1.43 |
| 89 (86–92) | 334 | 89.15 | 85.81–92.48 | 84.89–93.40 | 85–93 | 1.28 |
| 71 (65–78) | 191 | 71.16 | 64.74–77.59 | 62.52–79.81 | 63–80 | 1.35 |
| 34 (30–37) | 746 | 33.82 | 30.43–37.22 | 28.85–38.80 | 29–39 | 1.47 |
In every row the fourth column rounds to the printed interval and the fifth does not. The ratio ranges from approximately to . It differs from one estimate to the next, since it depends on the answers as well as on the weights. No common rescaling factor was used. Without weights, or with the weights of the August 2015 release, the nine percentages are not all reproduced: the rounded values are 77, 54, 39, 49, 12, 76, 88, 71, 33 and 75, 53, 40, 48, 12, 73, 88, 73, 33. The five tested interval methods for a proportion in the survey package of R, applied to the same design, reproduce none of the nine printed intervals. If each group is treated as a separate sample, the factor becomes ; eight rounded intervals are unchanged, and the eighth row becomes 62–80.
What survives
All nine percentages are reproduced and stand, and the three knowledge percentages still sum to 100. The three comparisons that the letter draws keep 95% intervals that exclude zero when the same linearisation is applied to each difference. The difference between 77% and 53% is percentage points ( to ). The difference between 89% and 74% among strong supporters is points ( to ), and the difference between 71% and 34% is points ( to ). The printed precision of each estimate is lost under this approximation. One confidence inference also changes: the matching stricter-law interval is –, while the interval using is –. The latter contains , so a simple majority preferring stricter laws is no longer established by the reported two-sided 95% interval criterion. The paper does not explicitly report a majority hypothesis test, and this change does not reverse the -versus- comparison. Neither calculation establishes a causal education effect or statistical equivalence to zero among non-strong supporters. The group to which the last two estimates refer is corrected in P054-N005.
Corrected
77% (95% CI 74–80) of Americans favoured universal background checks, yet only 53% (50–57) reported preferring stricter gun control laws. […] An estimated 41% (37–45) of Americans believed that universal background checks are already required by federal law, whereas 47% (43–51) correctly reported that a federal background check is required only for some gun purchases, and 12% (10–15) believed that no federal background checks are required.
[…] Among those who strongly supported universal background checks, 74% (95% CI 67–81) of those who incorrectly believed that the USA has universal background checks supported stricter gun laws, whereas 89% (85–93) of those who knew that some gun sales do not require background checks supported stricter laws. […] Among respondents who thought gun laws should be less strict than at present, 71% (95% CI 63–80) said they would never vote for a political candidate who did not share their position on gun control, compared with just 34% (29–39) of those who support stricter gun laws.
The letter should also state the release of the data, the respondents selected, the weights and the interval method that were used. If they are those of the recalculation, a sentence such as the following would serve: Estimates use the team weight of the February 2015 release of the survey data, on the 1384 respondents with valid answers to the three questions on gun laws, on universal background checks and on existing federal law. The 95% confidence intervals use a linearised variance that allows for the weights and treats respondents as independent.
These replacement intervals are conditional on the following approximation; they are not independently established full-design national intervals. The corrected intervals are , with and as defined under Evidence. They are approximate 95% intervals under three conditions: respondents can be treated as independent draws with the released weights; the linear and normal approximations are adequate; and the released weights identify the national population, with the retained respondents, including those answering the engagement question, identifying the same proportions in each group. If the variance under the full design of the survey is available, it should replace . The printed limits could be kept only with a documented inferential justification that accounts for the survey design and response selection.
My comment and the history of this entry
Suggested classification: Minor error.
My position My comment above; I suggested a Minor error.
The models’ position Under the stated survey reconstruction, every interval widens substantially, and the interval for stricter laws no longer excludes 50% at the two-sided 95% level: Moderate.