P015-E001 Moderate
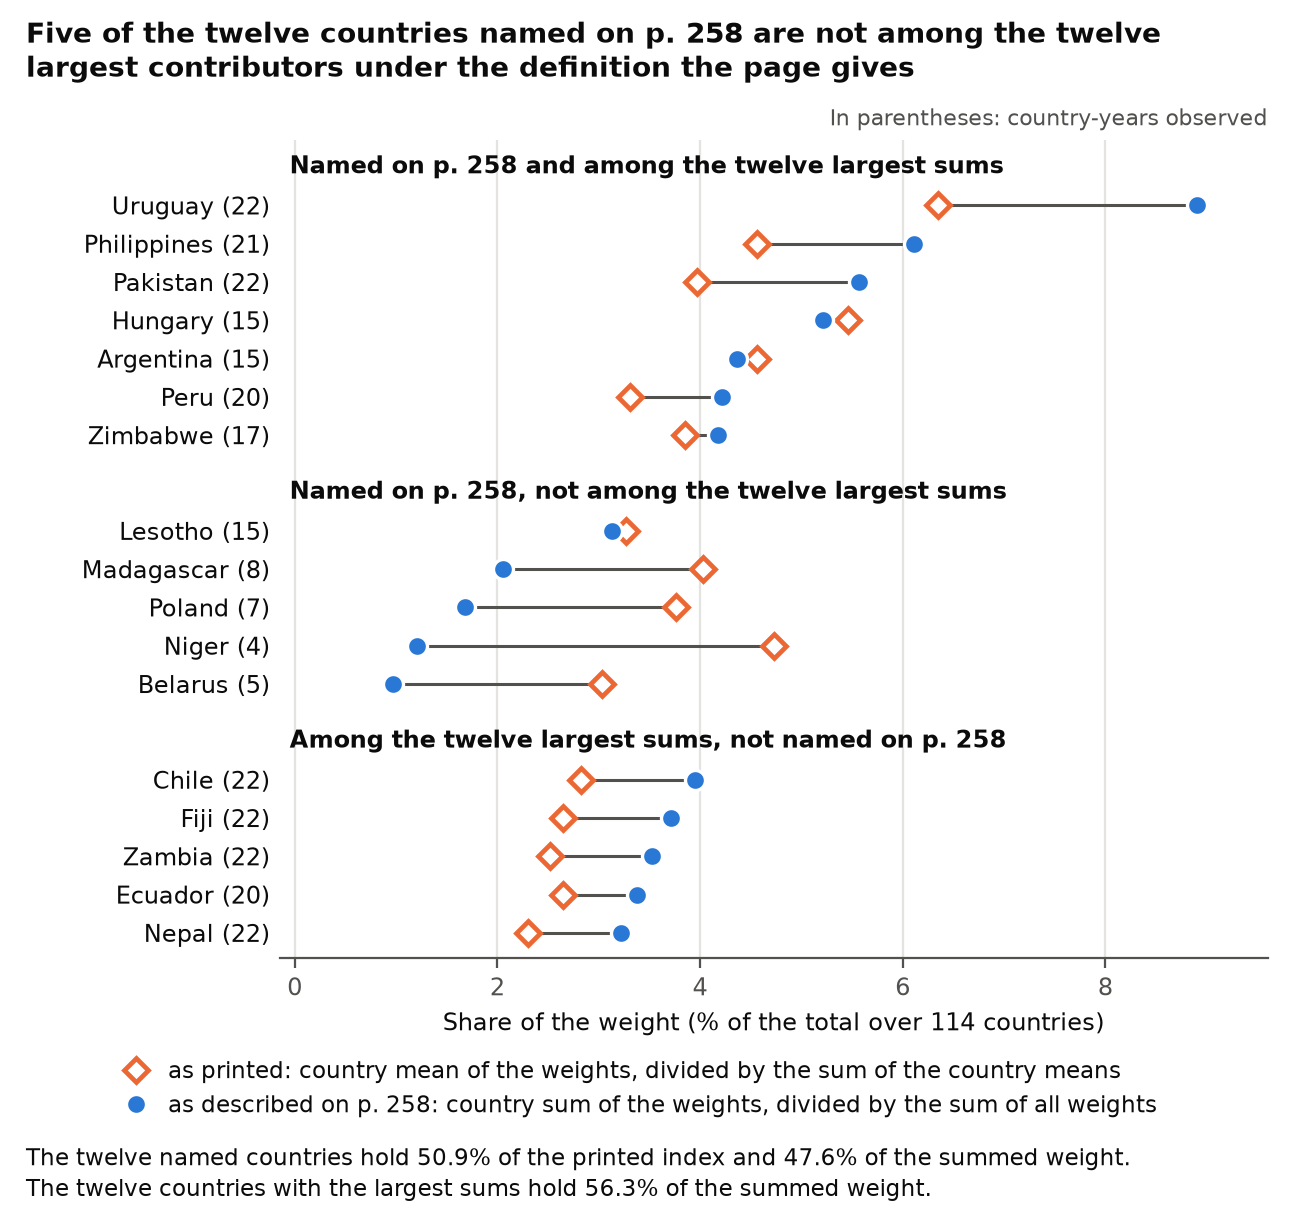
The country contributions reported for the Jensen illustration were computed from each country’s mean weight and not from the sum that the text describes; with sums, the twelve largest contributors hold 56% of the weight, five of the twelve named countries are replaced, and 34 countries are needed to reach 90%.
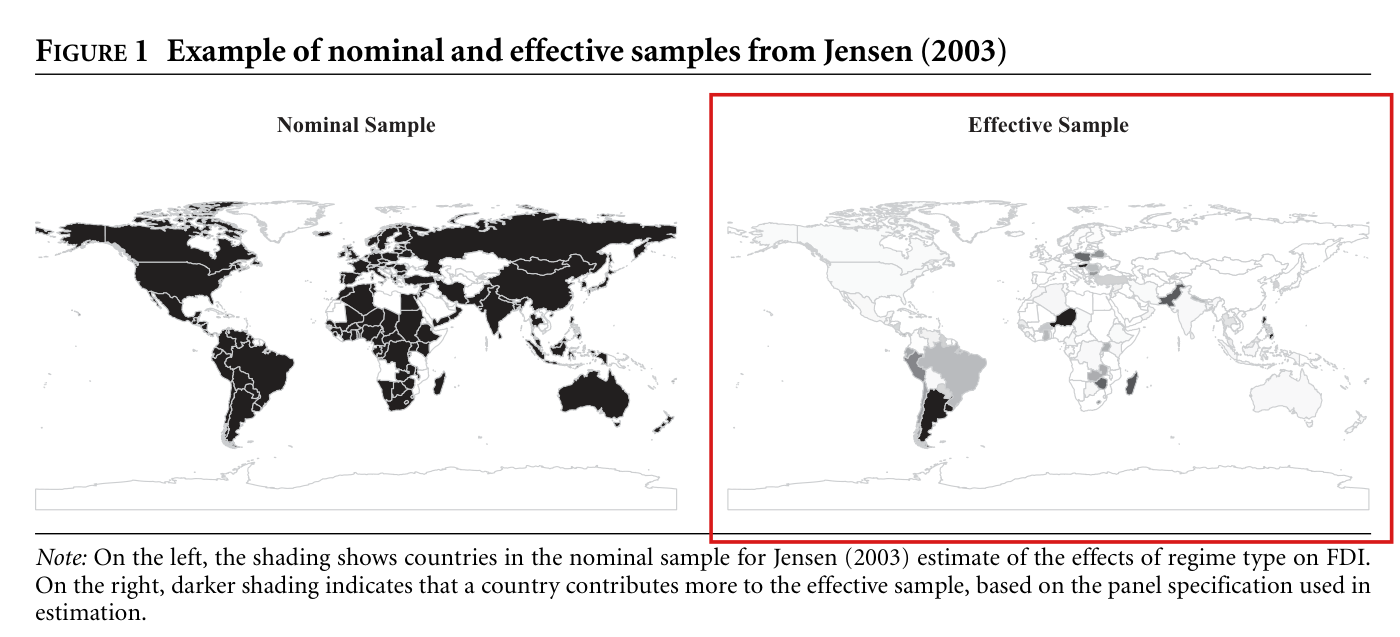
Section “Effects of Regime Type on FDI”, p. 258 (PDF p. 9): left column, from “To measure the extent” to the list of twelve countries; right column, first paragraph; Figure 1, right panel
See also under Formal statements (Lean): P015-T23
As printed
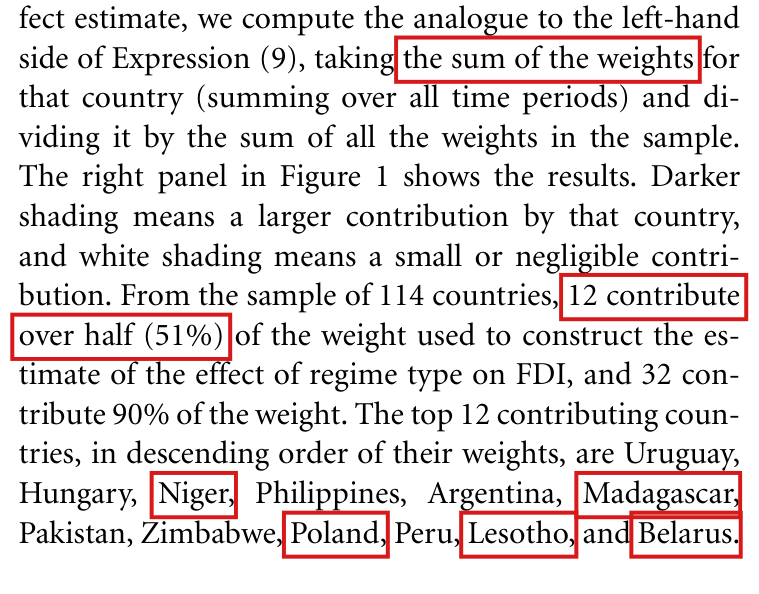
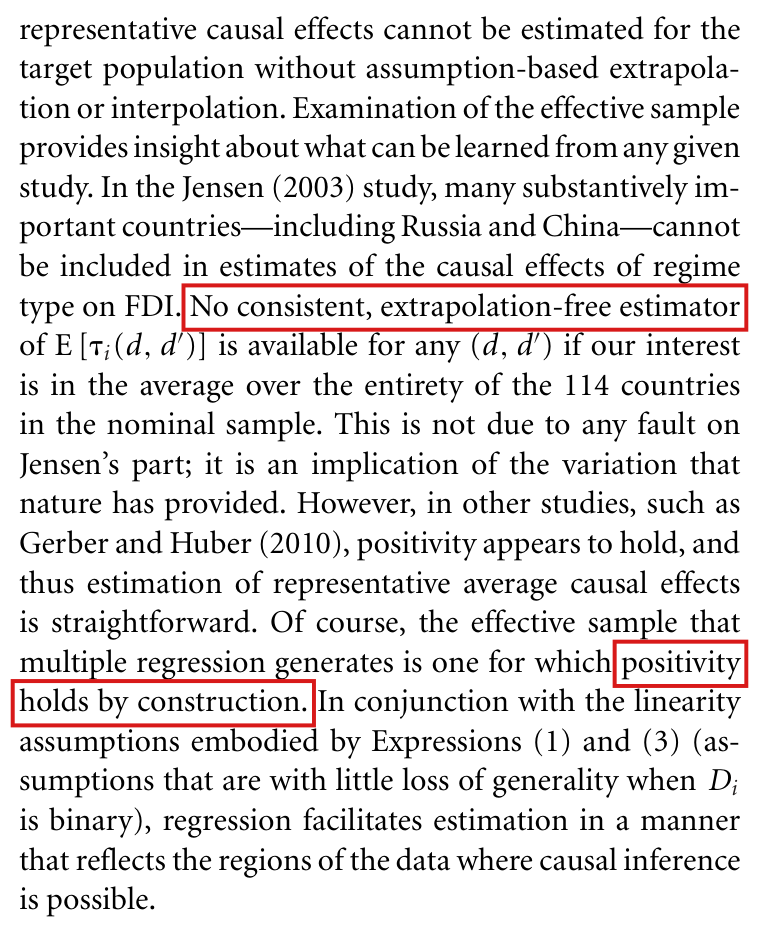
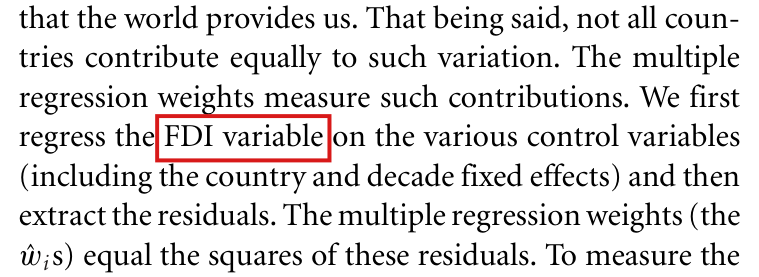
To measure the extent to which a given country contributes to the effect estimate, we compute the analogue to the left-hand side of Expression (9), taking the sum of the weights for that country (summing over all time periods) and dividing it by the sum of all the weights in the sample. The right panel in Figure 1 shows the results. Darker shading means a larger contribution by that country, and white shading means a small or negligible contribution. From the sample of 114 countries, 12 contribute over half (51%) of the weight used to construct the estimate of the effect of regime type on FDI, and 32 contribute 90% of the weight. The top 12 contributing countries, in descending order of their weights, are Uruguay, Hungary, Niger, Philippines, Argentina, Madagascar, Pakistan, Zimbabwe, Poland, Peru, Lesotho, and Belarus.
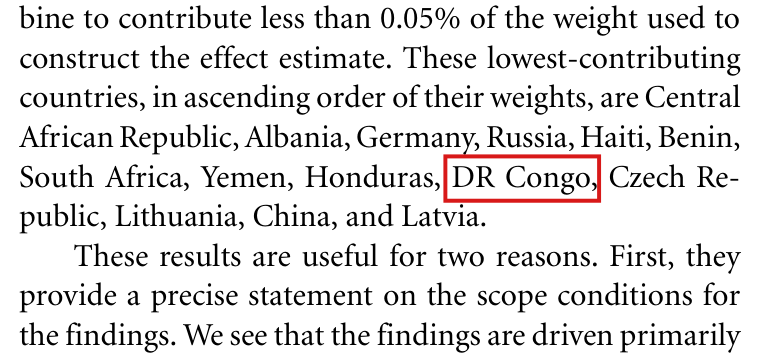
Importantly, the lowest-contributing 14 countries combine to contribute less than 0.05% of the weight used to construct the effect estimate. These lowest-contributing countries, in ascending order of their weights, are Central African Republic, Albania, Germany, Russia, Haiti, Benin, South Africa, Yemen, Honduras, DR Congo, Czech Republic, Lithuania, China, and Latvia.
The problem
The page defines the contribution of a country as the sum of its weights over all its years, divided by the sum of all the weights in the sample. This is the left side of Expression (9) with the indicator of the country. The numbers that follow were computed differently: from the mean weight of each country, divided by the sum of the 114 country means. The replication script takes the country mean (tapply(w, jensen.cc$country, mean), line 33) and shades the right panel of Figure 1 with it. Let be the share of country by sums and its number of observed years. Then the index of country means is
and for every country only if all countries with positive weight are observed for the same number of years. In this panel ranges from 1 to 22, and the index of country means raises the countries that are observed in few years. Niger, with 4 years, is third on the printed list and 27th by its sum. Under the definition that the page gives, the printed statements change as follows. The twelve named countries hold 47.6% of the weight, which is less than half. Five of them (Niger, Madagascar, Poland, Lesotho and Belarus) are not among the twelve largest contributors, and the order of the other seven changes. The largest 32 countries hold 89.2% of the weight, and 34 are needed to pass 90%. The list of the 14 lowest contributors changes in order and in one member: Namibia replaces China (its tenth name is a separate error, P015-E002). The regional summary and the advice on case selection in the right column were written from the printed list and the map.
Evidence an exact counterexample
I checked the exact recalculation from the authors' data. The regression of regime type on the stated controls was solved in rational arithmetic for all 1,630 country-years and 114 countries, and the residuals satisfy all 123 normal equations exactly. The index of country means reproduces the printed twelve in the printed order, with a share of 50.91%, and it reproduces the printed list of the 14 lowest once its tenth name is corrected (see P015-E002). The shares by country sums are in the last column of the table. Under sums, 10 countries hold 49.7% and 11 hold 53.1%. The printed 90% rounds the mean-based share of 89.71%; it does not assert a minimum of 32 countries to reach at least 90%.
| Quantity | As printed | Means | Sums |
|---|---|---|---|
| Twelve largest countries | 51% | 50.91% | 56.33% |
| Twelve countries named in the text | 51% | 50.91% | 47.58% |
| Largest 32 countries | 90% | 89.71% | 89.25% |
| Largest 33 countries | – | 90.25% | 89.84% |
| Largest 34 countries | – | 90.72% | 90.35% |
| Lowest 14 countries | 0.0458% | 0.0107% |
What survives
The finding that few countries carry the estimate survives: 12 of 114 countries hold 56.3% of the weight, 11 pass one half, and 34 pass 90%. The 14 lowest contributors hold 0.011%, inside the printed bound of 0.05%, and Russia, China and Germany each hold less than 0.005%. The aggregation by country takes place after the regression is fitted, so the OLS coefficient and the weights do not change. The left panel of Figure 1, the definition of the weights and the application to Gerber and Huber (2010) are not touched by this error. What changes is the right panel of Figure 1, the two lists, the shares, and the regional summary. Niger, Madagascar, Poland, Lesotho and Belarus leave the twelve, and Chile, Fiji, Zambia, Ecuador and Nepal enter. If the printed numbers were kept, the index would have to be described as a country’s average weight per observed year, which is a different quantity from the contribution that Expression (9) defines.
Corrected
To measure the extent to which a given country contributes to the effect estimate, we compute the analogue to the left-hand side of Expression (9), taking the sum of the weights for that country (summing over all time periods) and dividing it by the sum of all the weights in the sample. The right panel in Figure 1 shows the results. Darker shading means a larger contribution by that country, and white shading means a small or negligible contribution. From the sample of 114 countries, 12 contribute over half (56%) of the weight used to construct the estimate of the effect of regime type on FDI, and 34 contribute at least 90% of the weight. The top 12 contributing countries, in descending order of their weights, are Uruguay, Philippines, Pakistan, Hungary, Argentina, Peru, Zimbabwe, Chile, Fiji, Zambia, Ecuador, and Nepal.
Importantly, the lowest-contributing 14 countries combine to contribute less than 0.05% of the weight used to construct the effect estimate. These lowest-contributing countries, in ascending order of their weights, are Central African Republic and Albania (both with weight zero), Russia, Germany, Haiti, Honduras, Benin, South Africa, Yemen, Republic of the Congo, Czech Republic, Latvia, Lithuania, and Namibia.
In both lists the order of the countries that remain also changes. The right panel of Figure 1 is to be redrawn with shading proportional to the country sums, and the regional summary and the remarks on case selection are to be rewritten from the corrected lists. The exact shares are 56.3347% for the twelve largest contributors, 90.3453% for the largest 34 (the largest 33 hold 89.8429%), and 0.0107% for the lowest 14.



My comment and the history of this entry
Suggested classification: Minor error.
My position My comment above; I suggested a Minor error.
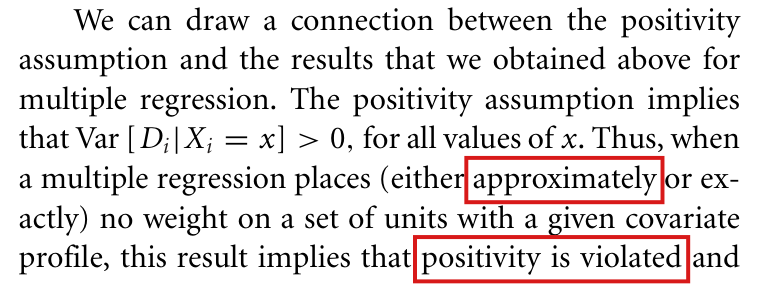
The models’ position Under its natural reading, the passage also makes claims about the support of the endpoints and about what an estimator cannot do. These fail even though the regression theorem holds, so a reader who applies the stated diagnostic can be materially misled: Moderate.