P034-E001 Minor
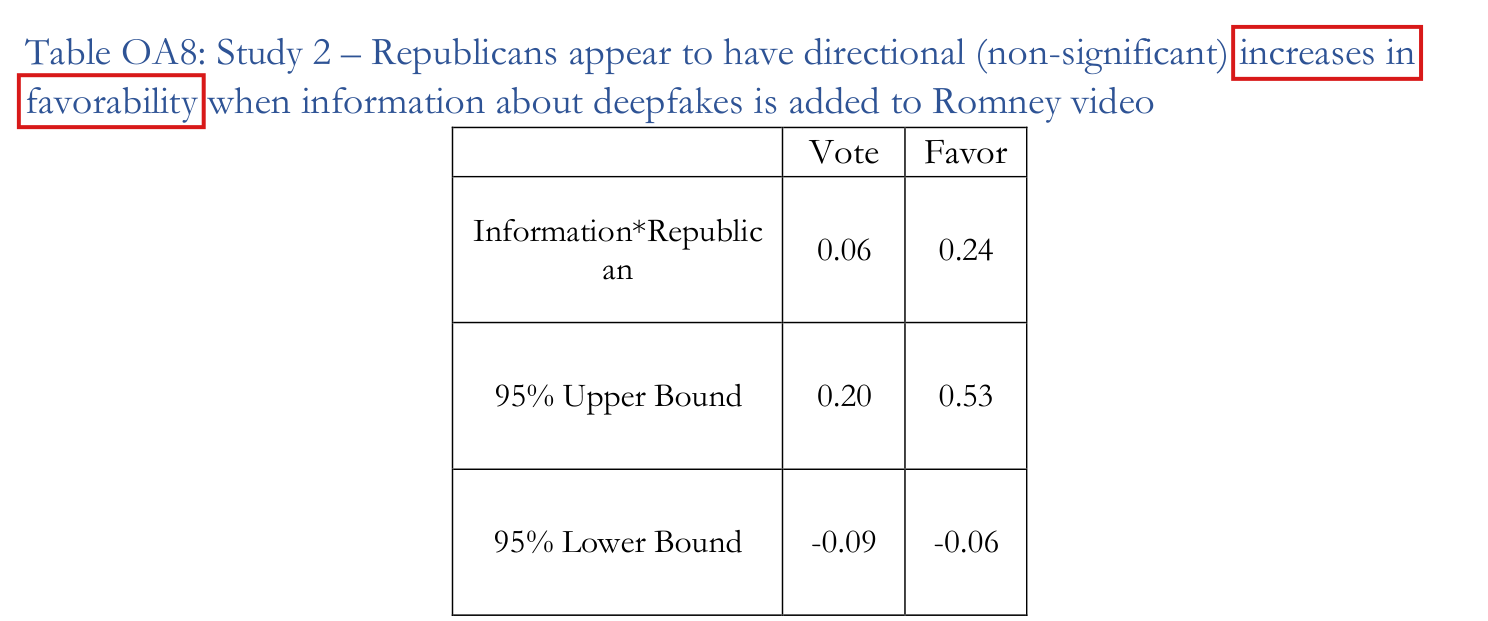
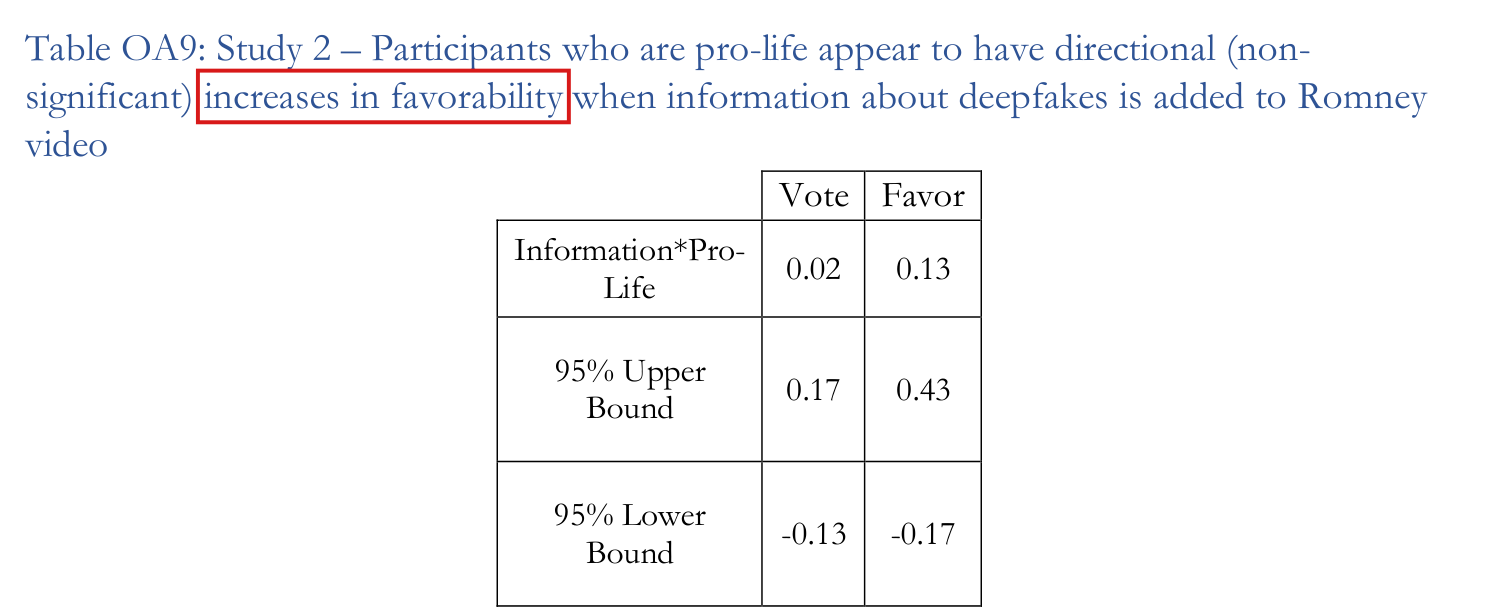
The titles of Tables OA8 and OA9 report “increases” among Republicans and among pro-life participants, but the estimated effects of the information within these two groups are slightly negative and not distinguishable from zero; the tables show differences between groups that are positive and not significant.
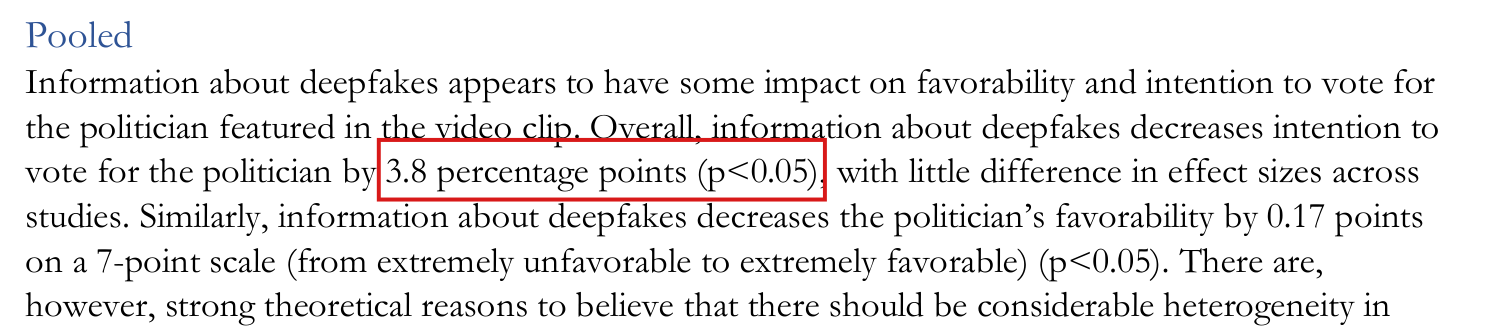
Appendix, titles of Tables OA8 and OA9, p. 15 (PDF p. 15 of the Appendix), repeated in the contents, p. 1; Section 5, “Pooled”, p. 19 (PDF p. 19 of the Appendix)
As printed
Appendix p. 15: “Table OA8: Study 2 – Republicans appear to have directional (non-significant) increases in favorability when information about deepfakes is added to Romney video”. The table has the columns Vote and Favor. Information*Republican: 0.06, 0.24. 95% Upper Bound: 0.20, 0.53. 95% Lower Bound: , .
Appendix p. 15: “Table OA9: Study 2 – Participants who are pro-life appear to have directional (non-significant) increases in favorability when information about deepfakes is added to Romney video”. Information*Pro-Life: 0.02, 0.13. 95% Upper Bound: 0.17, 0.43. 95% Lower Bound: , .
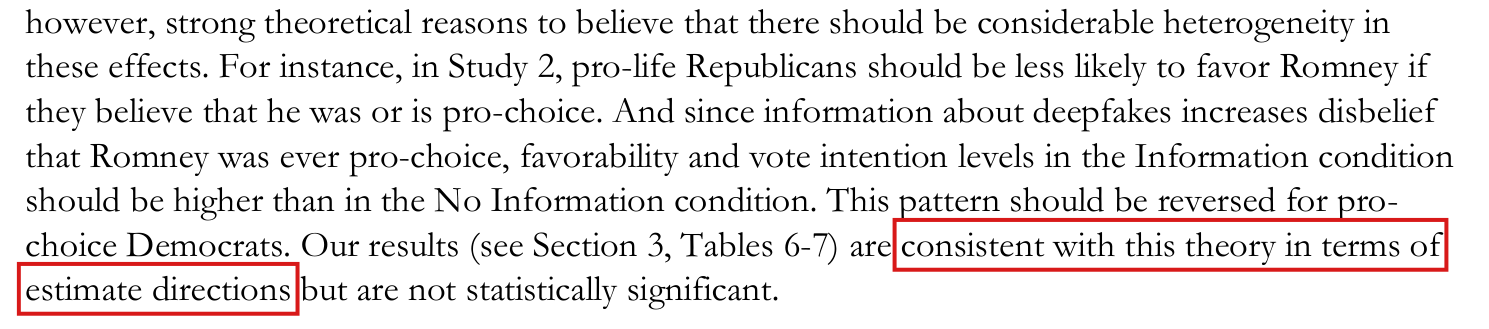
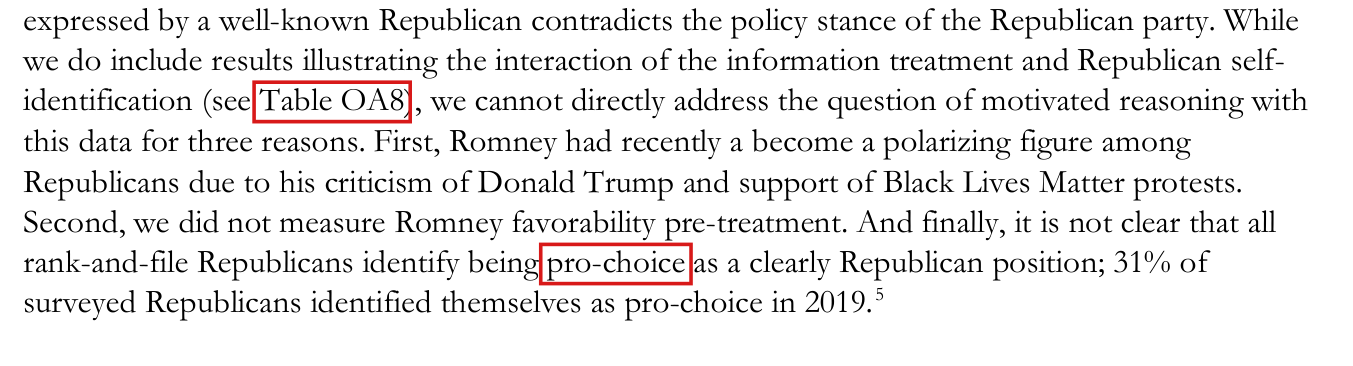
Appendix p. 19: “For instance, in Study 2, pro-life Republicans should be less likely to favor Romney if they believe that he was or is pro-choice. And since information about deepfakes increases disbelief that Romney was ever pro-choice, favorability and vote intention levels in the Information condition should be higher than in the No Information condition. This pattern should be reversed for pro-choice Democrats. Our results (see Section 3, Tables 6-7) are consistent with this theory in terms of estimate directions but are not statistically significant.”
The problem
Each table reports, for each outcome, one coefficient with its bounds: the interaction of the information about deepfakes with the group. In each regression, let be the coefficient on the information and let be the coefficient on the interaction. The fitted outcome is , where indicates the information, the group and the covariates. The estimated effect of the information is then in the comparison group, which is Democrats in Table OA8 and pro-choice participants in Table OA9, and in the group that the title names. The tables print and not . A positive says that the estimated effect is larger in the named group than in the comparison group. It does not say that the effect in the named group is positive.
In the Study 2 data all four sums are negative. They are for the vote and for favorability among Republicans, and and among pro-life participants. Each 95% interval for a sum contains zero. The titles describe as increases the two favorability estimates that are slightly negative, and the data establish neither an increase nor a decrease within either group.
Read as a statement about the levels that the theory predicts, the sentence of Section 5 is not supported either: the theory predicts higher favorability and vote intention with the information among pro-life Republicans. The estimates do agree with the prediction of both pre-analysis plans of Study 2, which is comparative. The plans expect the interaction of the treatment with a Republican indicator, and with a pro-life indicator, to be positive. All four interactions are positive, and none is statistically significant. Tables OA8 and OA9 come from separate regressions, and neither estimates a separate effect for respondents who are both pro-life and Republican.
Evidence a recalculation from the source
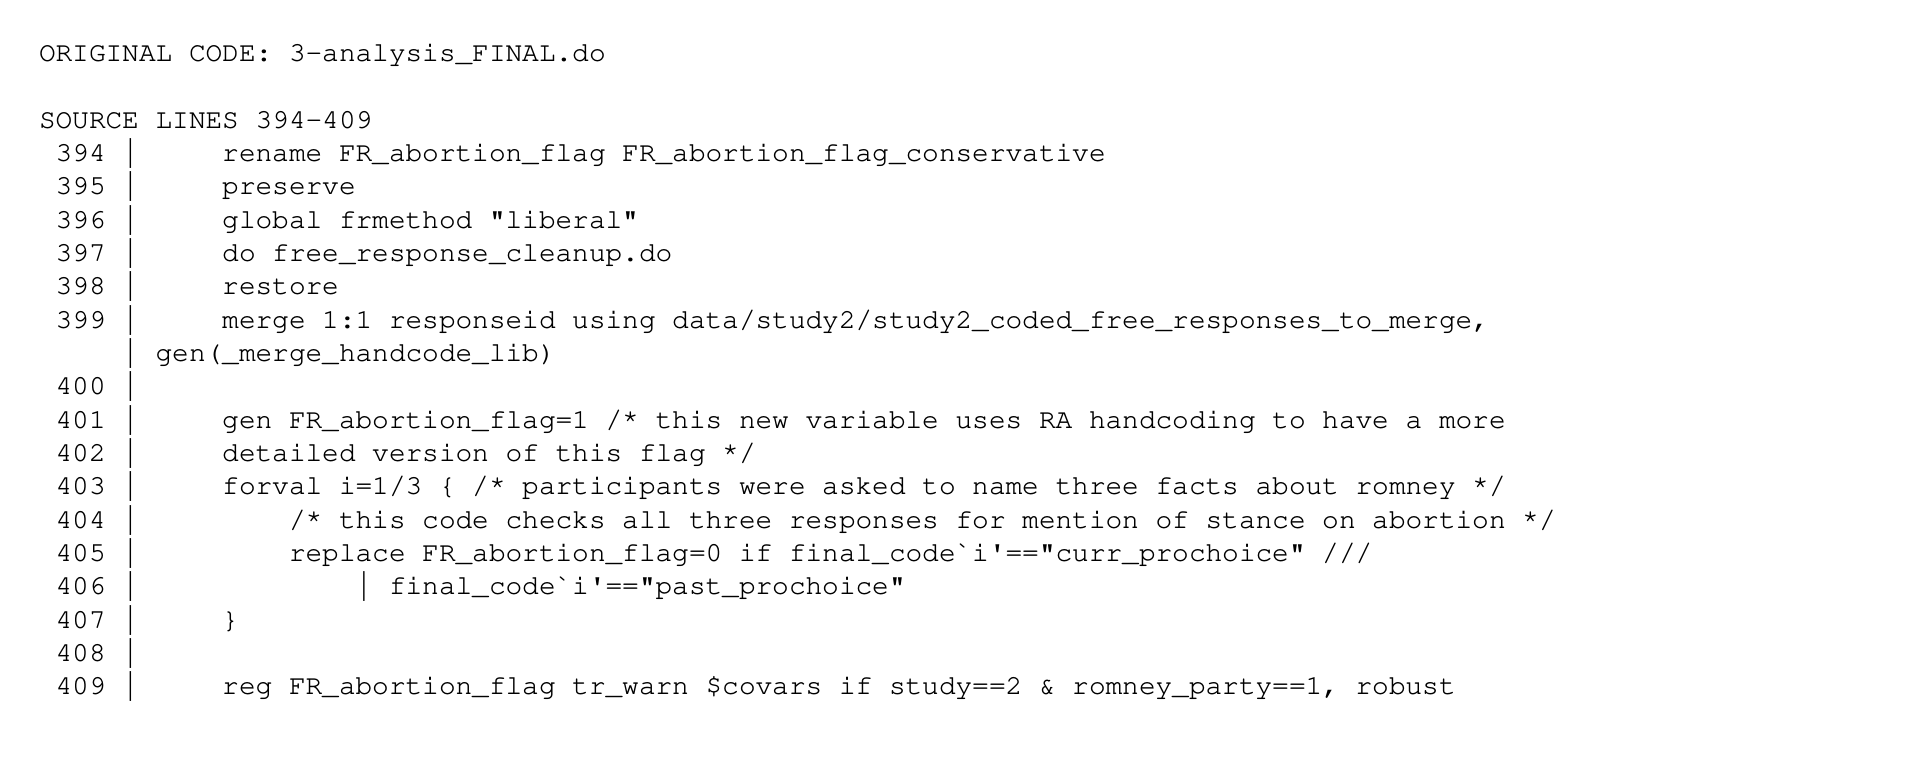
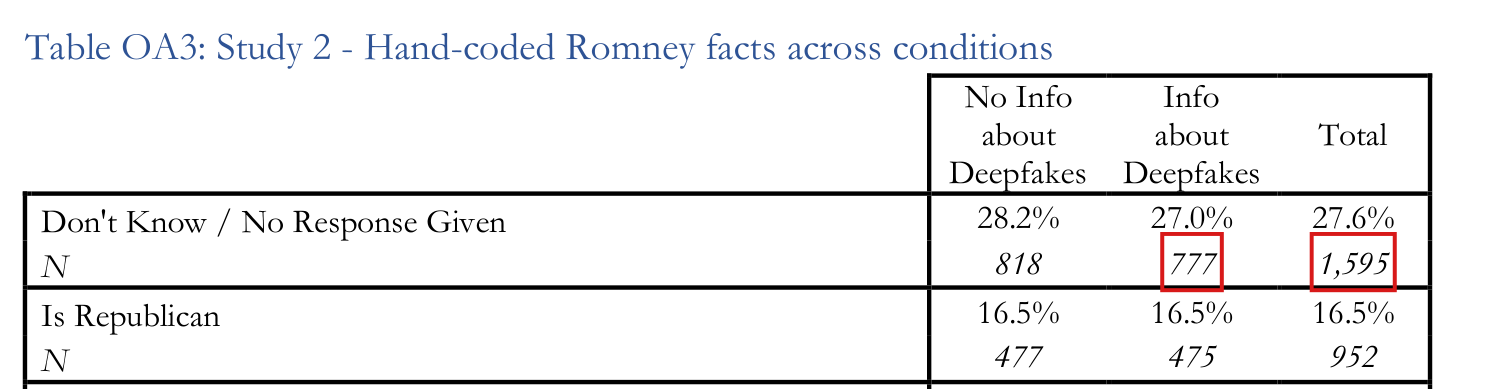
The evidence is a recalculation from the public Study 2 data. The final cleaning code and the four regressions of the replication files were translated from Stata into Python; Stata was not run. The recalculation gives the analysis sample of 1,925 respondents, 966 without and 959 with information, and it reproduces the four printed interactions with their printed bounds. The regressions of Table OA8 exclude Independents and use 1,750 respondents. Each interval below is the estimate robust standard errors, as in the Appendix. The standard error of uses the covariance of the two coefficients, that is, .
| Table, outcome | SE of | 95% interval for | ||||
|---|---|---|---|---|---|---|
| OA8, Vote | 1,750 | |||||
| OA8, Favor | 1,750 | |||||
| OA9, Vote | 1,925 | |||||
| OA9, Favor | 1,925 |
The vote is coded , , and favorability from to , and the entries are points on these scales. The signs do not depend on rounding: solving the normal equations of the four regressions in exact rational arithmetic, I find that and in each.
What survives
The four interactions, their printed bounds and their lack of statistical significance stand, and their signs agree with the predictions of both pre-analysis plans. The regressions are unchanged; only their description changes. The pooled estimates of Section 5 and the results of the main text come from other regressions and do not depend on these titles. What changes is the reading of the tables: the estimates do not show increases within either group, and the tables do not support the levels that the theory of Section 5 predicts. The check does not establish a decrease within either group.
Corrected
Appendix pp. 1 and 15: “Table OA8: Study 2 – Information effects on vote intention and favorability are estimated to be less negative among Republicans than Democrats; the differences are not statistically significant”.
Appendix pp. 1 and 15: “Table OA9: Study 2 – Information effects on vote intention and favorability are estimated to be less negative among pro-life than pro-choice participants; the differences are not statistically significant”.
Appendix p. 19, in place of the last sentence quoted above: “The interaction point estimates of Tables OA8–OA9 are positive, consistent with the pre-specified comparative predictions, but the differences are not statistically significant. The effects within Republicans and within pro-life participants are estimated to be negative on both outcomes, with 95% intervals that include zero; these tables do not estimate a separate effect for participants who are both pro-life and Republican.”
The sentences before it can stay as a statement of the theory. An effect within a group is the sum , and it is to be reported with an interval that uses the covariance of the two coefficients, as in the table above. The cross-reference “Section 3, Tables 6-7” of the printed sentence is corrected in P034-E015.