LLM-generated corrections to the published research of P. M. Aronow

Journal article P035

Corrections to: The Effect of Images of Michelle Obama's Face on Trick-or-Treaters' Dietary Choices: A Randomized Control Trial

P. M. Aronow, Dean Karlan, and Lauren E. Pinson (2018). The Effect of Images of Michelle Obama's Face on Trick-or-Treaters' Dietary Choices: A Randomized Control Trial. PLOS ONE 13(1):e0189693.

DOI
10.1371/journal.pone.0189693
Audited edition
PLOS ONE, 2018, 13(1):e0189693; 6 pages in the audited file
SHA-256 of the audited file
6e86409b33b193413652f023ceafa1c1c4c3ff88a46d05ed27e18f2002bb24a3
Permanent address
https://pmaronow.github.io/llm-audit/works/P035/

Summary

On three Halloweens in New Haven, 1223 trick-or-treaters were assigned to a side of a porch showing a photograph of Michelle Obama or to a comparison side; fruit-or-candy choices were recorded for 1222. The pooled estimates of fruit choice were 28.1% against 23.5%, a 19% relative increase (p=0.091p = 0.091). 2 entries are classified as errors (1 Major, 1 Minor), and 2 are clarity notes; 1 further concern was not confirmed and 2 remain unresolved. The porch-condition experiment alone does not identify the campaign contribution behind the categorical abstract attribution (P035-E001). The Introduction proposes reinforcement through a reminder as a possible pathway, which the counterexample does not refute.

What was and was not checked

I checked the following calculations and compatibility claims against the released data and the replication code.

  • The sample sizes: 165+422+636=1223165 + 422 + 636 = 1223 enrolled, and 1222 analysed after the one disclosed missing outcome (164+422+636164 + 422 + 636 in S1 Table).
  • The descriptive statistics: mean age 8.52 (printed 8.5) and 52.6% male among the 1222 with gender recorded (printed 53%), and by year 7.84 and 57.6%, 8.53 and 56.2%, 8.69 and 49.0% (printed 7.8 and 58%, 8.5 and 56%, 8.7 and 49%).
  • The pooled estimates 28.1% (23.8–32.4%) and 23.5% (20.5–26.5%), recalculated as 0.28066 (0.23751, 0.32381) and 0.23525 (0.20512, 0.26538).
  • The two-sided p=0.091p = 0.091, recalculated as 0.0908 with standard error 0.0269; under that calculation, the difference is significant at the 0.10 level, as the paper states.
  • The 19% relative increase: the ratio of the pooled proportions is 1.193. It is not an increase of 19 percentage points.
  • The eight points of Fig. 1 and their interval endpoints, to the resolution of the published graph.
  • The NN, mean and standard error in each Obama and Romney row of S1 Table reproduce from the data. The Clinton and No photo rows are compatible with the pooled comparison counts, but the released data do not authenticate those subgroup assignments (see P035-N003).
  • The statement that the findings are substantively unchanged by imputing the missing outcome: imputing fruit gives p=0.084p = 0.084 and imputing candy gives p=0.093p = 0.093.
  • The described method, which the replication code follows: yearly assignment shares as treatment probabilities, normal-approximation intervals and heteroskedasticity-robust standard errors, with the one qualification in P035-N004. The numerical reproduction used R 4.4.2 and its installed packages.

I read all six pages. The paper has no proofs or mathematical displays, and every numbered citation in the text has an entry in the reference list.

I opened the zip file nested inside the data release and found its three replication files byte-identical to the copies supplied separately.

The following were not checked. The cited works other than reference [4], which was consulted only for P035-E002, were not read; in particular, the 79% and 82% informal votes attributed to reference [11] were not compared with their source. The sources contain no record of how children were allocated to the sides in 2014 and 2015 beyond the description in the Methods, of the comparison condition each child saw, or of the 2015 priming assignment. The questions about assignment in 2014 and 2015, namely whether the queue-based allocation was random and whether it left assignments dependent across children or related to their choices, and the question in P035-N003 therefore could not be settled. These checks do not show that the paper is correct in the respects that were not examined.

The identification check preserves the Introduction’s proposed reminder pathway as a hypothesis. Its exact hypothetical models show what the porch contrast alone does not identify about a campaign contribution even granting valid assignment; they neither refute that pathway nor establish that the campaign had no effect.

Headline claims and related corrections

  1. Viewing a photograph of Michelle Obama's face, relative to control conditions, caused children to be 19% more likely to choose fruit over candy.

    Abstract, Results (p. 2/6); Introduction (p. 2/6); ratio of the two pooled means in Fig 1 and the Results text

    See P035-E001.

  2. Pooled over three Halloweens, 28.1% (95% CI 23.8-32.4%) of participants in the Obama treatment chose fruit, against 23.5% (20.5-26.5%) in the pooled comparison group.

    Results and conclusions (pp. 4/6-5/6); Fig 1, pooled rows; replication script halloweenforest_PLOS_final.R

    See P035-N004.

  3. The pooled difference is statistically significant at the 0.10 level (two-sided p=0.091p=0.091).

    Results and conclusions (p. 5/6); replication script, section '# pvalues' (lmfit1)

    See P035-N004.

  4. Michelle Obama's initiative to reduce childhood obesity has influenced children's dietary preferences; the photograph experiment evaluates the initiative's microfoundations.

    Abstract, Conclusions and Introduction (p. 2/6); pooled contrast in Fig 1; intervention description (p. 3/6); S1 Table

    See P035-E001, P035-N003.

  5. The study is a multi-year randomized control trial in which trick-or-treaters were randomly assigned to the Michelle Obama side or the Comparison side of the porch.

    Title; Abstract, Design and Intervention (p. 1/6); Methods, first paragraph (pp. 2/6-3/6); S1 Table

  6. There were 1223 participants (165 in 2012, 422 in 2014, 636 in 2015), on average 8.5 years old and 53% male, with yearly averages 7.8/58%, 8.5/56% and 8.7/49%.

    Abstract, Participants (p. 1/6); Methods (pp. 2/6-3/6); released data; S1 Table (NN column)

  7. Eligible participants were trick-or-treaters over the age of three who approached the house.

    Abstract, Eligibility (p. 1/6); Methods, second paragraph (p. 3/6); released data (age)

  8. The yearly arm means and the disaggregated comparison arms are as shown in Fig 1 and S1 Table.

    Results and conclusions (p. 5/6, 'We present the estimates for each year in Fig 1'); Methods (p. 3/6, pointer to S1 Table); Fig 1; S1 Table

    See P035-N003.

  9. Findings are substantively unchanged by imputing either a fruit or a candy outcome for the one participant with a missing outcome.

    Methods, last paragraph (p. 3/6); released data and script

    See P035-N004.

  10. Whether the observed effect extends beyond these Halloween visitors at this New Haven porch requires further research.

    Abstract, Conclusions (p. 2/6); Results and conclusions (p. 5/6); the stated setting and sample design

Corrections

Major (1)

A central result, method or key claim fails for a non-trivial reason, and the repair changes what the paper establishes.

The experiment estimates the effect of assignment to the Michelle Obama porch condition; it does not establish that her initiative to reduce childhood obesity caused the difference.

Abstract, Conclusions, first sentence, p. 2/6 (PDF p. 2), and the campaign-effect wording in Results and conclusions, p. 5/6 (PDF p. 5); read with the hypothesis and rationale in the Introduction, third paragraph, p. 2/6

See also under Formal statements (Lean): P035-T1, P035-T3

I disputed this classification, but as a rule, deferred to the models’ final judgment: see my comment and the history of this entry.

As printed

Abstract, Results (p. 2/6). We estimate that viewing a photograph of Michelle Obama’s face relative to control conditions caused children to be 19% more likely to choose fruit over candy.

Abstract, Conclusions (p. 2/6). Michelle Obama’s initiative to reduce childhood obesity has influenced children’s dietary preferences. Whether this influence extends beyond Halloween trick-or-treating in New Haven, CT on the porch of an economics professor requires further research.

Introduction, context (p. 2/6). While the campaign gained publicity, an experimental evaluation of the effects of the entire campaign would not be possible due to the initiative being rolled out across the United States through mass media.

However, we have experimentally assessed the microfoundations of Let’s Move in order to evaluate whether the public health campaign altered dietary decision-making. When children are exposed to the image of a figurehead regularly associated with the public health campaign’s message, the subconscious reminder may reinforce the message.

Results and conclusions (p. 5/6). In particular, this is a strongly Democratic neighborhood, and if children in Democratic households are either more aware of Michelle Obama’s campaign or more favorably disposed to it, we would generate an overestimate of the treatment effect of her campaign on the general population of those in the United States.

The problem

The experiment assigned children to a side of the porch. The Obama side had a large photograph of Michelle Obama and a poster with the name “Obama”; I refer to assignment to this side as the Michelle Obama porch condition. The comparison side had a photograph of Ann Romney (2012) or of Hillary Clinton (2014, 2015), or no photograph (2014, 2015), and posters with the name “Romney” or “Clinton”. Exposure to the Let’s Move campaign, Michelle Obama’s initiative to reduce childhood obesity, was not varied, and the recorded variables include no measure of campaign exposure, recall or the proposed reminder pathway. Under the assumptions of the design (valid assignment, consistency and no interference), the contrast between the two sides estimates the effect of the Michelle Obama porch condition. The first sentence of the Conclusions attributes that effect to the campaign. The attribution requires further assumptions linking at least part of the contrast to the campaign. Recognition of the person, a political association, or another response to the name or the photograph could account for the difference without any campaign contribution. The Introduction explicitly motivates campaign reinforcement through the figurehead’s association with the health message. It proposes this pathway without imposing or testing a restriction that excludes other pathways, or otherwise ensures that some of the contrast comes from the campaign.

The paper says that it cannot evaluate the entire nationwide campaign, and it limits its conclusion to Halloween in New Haven. Neither qualification supplies the missing restriction, since the attribution is not identified even for the children on this porch. The Introduction states a research aim and a proposed explanation: a subconscious reminder may reinforce the campaign’s message. That passage need not be corrected as though it asserted a separately demonstrated mechanism. The categorical attribution is in the abstract’s Conclusions; p. 5/6 continues it by calling the estimate “the treatment effect of her campaign” in its conditional discussion of extrapolation.

The correction weakens the conclusion and changes no number. To establish some campaign contribution, one could assume that noncampaign contributions are zero, or bound their combined contribution below a positive porch-condition effect. The paper supplies neither restriction. The correction does not say that the campaign had no influence, that the proposed explanation is unreasonable, or that there is no contextual evidence favoring it. These data do not settle the actual campaign contribution in either direction. I also do not count the wording of the Results sentence as an error. Since the photograph and the name poster were always assigned together, the design cannot separate their contributions. But “viewing a photograph of Michelle Obama’s face” can reasonably be read as a label for the Michelle Obama porch condition.

Evidence an exact counterexample

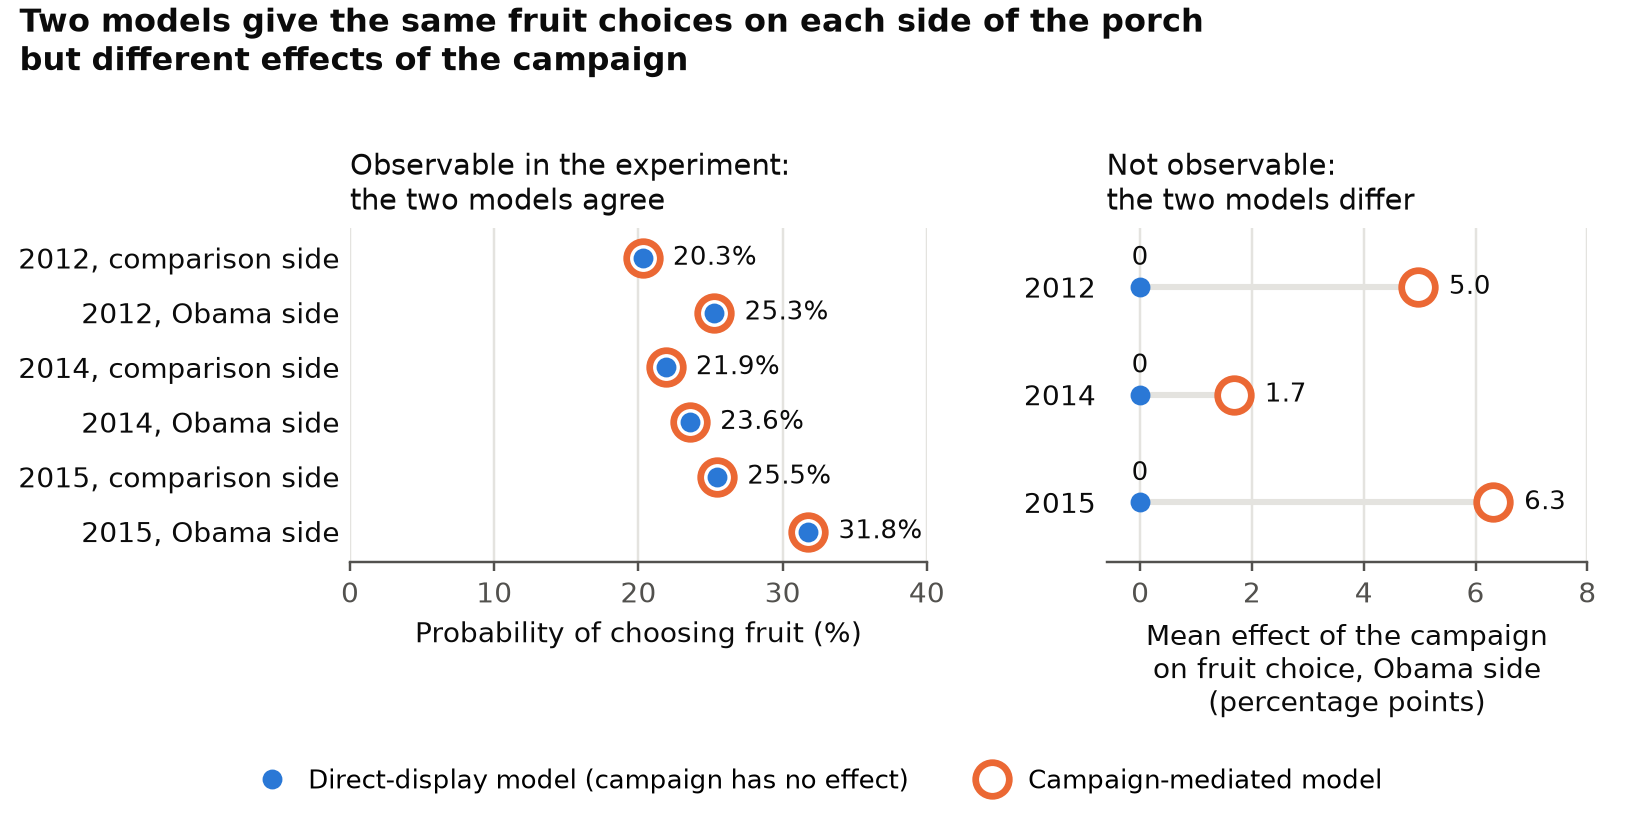
The evidence is an exact counterexample: two models of the experiment that agree on everything it can observe and disagree on the effect of the campaign. The mathematical notation is introduced for this check; the paper itself names the Obama and Comparison conditions without defining a mediator or campaign-effect parameter. Fix a year yy, and let py0p_{y0} and py1p_{y1} be the proportions choosing fruit on the comparison side and on the Obama side in the released data. Let LyL_y be the least common multiple of their denominators, and set ty0=Lypy0t_{y0} = L_y p_{y0} and ty1=Lypy1t_{y1} = L_y p_{y1}, which are integers. Each child has a latent value RR, uniform on {1,…,Ly}\{1, \dots, L_y\} and independent of the assigned side Z∈{0,1}Z \in \{0,1\}, where Z=1Z = 1 denotes the Obama side. Let A∈{0,1}A \in \{0,1\} indicate whether the campaign is present, so that A=1A = 1 throughout the study. This counterfactual holds the specified porch displays fixed when the campaign is absent. I write 11 for fruit and 00 for candy, and I define the potential outcomes in the direct-display model and in the campaign-mediated model by

YyD(z,a;r)=1{r≤ty0+z(ty1−ty0)},YyM(z,a;r)=1{r≤ty0+az(ty1−ty0)}.Y^{\mathrm{D}}_y(z,a;r) = \mathbf{1}\{ r \le t_{y0} + z (t_{y1} - t_{y0}) \}, \qquad Y^{\mathrm{M}}_y(z,a;r) = \mathbf{1}\{ r \le t_{y0} + a z (t_{y1} - t_{y0}) \}.

Setting a=1a = 1, I have YyD(z,1;r)=YyM(z,1;r)Y^{\mathrm{D}}_y(z,1;r) = Y^{\mathrm{M}}_y(z,1;r) for every zz and rr. Since A=1A = 1 throughout the study, the two models give each child the same outcome on either side, and they give the same distribution to every data set that the experiment can produce, at any sample size. In both models the probability of choosing fruit is ty0/Ly=py0t_{y0}/L_y = p_{y0} on the comparison side and ty1/Ly=py1t_{y1}/L_y = p_{y1} on the Obama side.

The two models differ in the effect of the campaign. In the direct-display model, aa does not enter the definition, which implies that YyD(z,1;r)−YyD(z,0;r)=0Y^{\mathrm{D}}_y(z,1;r) - Y^{\mathrm{D}}_y(z,0;r) = 0 for every zz and rr. In the campaign-mediated model, the difference YyM(1,1;r)−YyM(1,0;r)Y^{\mathrm{M}}_y(1,1;r) - Y^{\mathrm{M}}_y(1,0;r) equals 11 if ty0<r≤ty1t_{y0} < r \le t_{y1} and 00 otherwise. Taking the mean over the latent value, I obtain

E[YyM(1,1;R)−YyM(1,0;R)]=ty1−ty0Ly=py1−py0>0.\mathbb{E}\bigl[ Y^{\mathrm{M}}_y(1,1;R) - Y^{\mathrm{M}}_y(1,0;R) \bigr] = \frac{t_{y1} - t_{y0}}{L_y} = p_{y1} - p_{y0} > 0 .

The right side is positive in each of the three years, as the table shows.

The two models in each year. Both models reproduce the proportions choosing fruit in the released data (second and third columns). The last two columns give the mean effect of the campaign on the Obama side in each model.
YearComparison side, py0p_{y0}Obama side, py1p_{y1}Direct-display modelCampaign-mediated model
201214/69≈0.20314/69 \approx 0.20324/95≈0.25324/95 \approx 0.25300326/6555≈0.050326/6555 \approx 0.050
201458/265≈0.21958/265 \approx 0.21937/157≈0.23637/157 \approx 0.23600699/41605≈0.017699/41605 \approx 0.017
2015113/444≈0.255113/444 \approx 0.25561/192≈0.31861/192 \approx 0.31800449/7104≈0.063449/7104 \approx 0.063

A quantity that the experiment identifies takes the same value in any two models with the same observable distribution. The effect of the campaign is 00 in the direct-display model and positive in the campaign-mediated model. I conclude that the experiment does not identify it. Both models assume random assignment, consistency and no interference, and in both the Michelle Obama porch condition has an effect. They can also share the stated public association between Michelle Obama and the campaign: in the direct-display model, that association does not affect the choice. Calibration to the observed proportions specifies an exact counterexample; it does not assert that the unknown population probabilities equal those sample proportions.

The construction also respects the disclosed comparison conditions. Applying it separately to each comparison protocol reproduces every integer allocation compatible with S1 Table and the pooled counts: Romney in 2012; Clinton and no photograph in 2014; and either compatible Clinton/no-photograph split in 2015. Averaging over protocols leaves the campaign effect on the Obama side equal to py1−py0p_{y1}-p_{y0} in the campaign-mediated model and zero in the direct-display model. The compatible splits are not recovered participant labels. Both models can include the disclosed 2014 prompting and the separately randomized 2015 prompt with no effect on choice. The paper does not require a nonzero prompt effect, so this completion is permitted. Pooling the prompt is not itself a defect, and these comparisons do not resolve the separate questions about queue assignment or interference.

A recalculation from the released data, with the estimator in the replication code, reproduces the printed estimates. The correction changes none of them.

The printed estimates beside the recalculation from the released data.
QuantityPrintedRecalculated
Fruit choice, Obama side (95% interval)28.1% (23.8–32.4%)0.28066 (0.23751, 0.32381)
Fruit choice, comparison side (95% interval)23.5% (20.5–26.5%)0.23525 (0.20512, 0.26538)
Relative increase19%0.19305
Two-sided pp0.0910.09078
What survives

The yearly proportions on each side, the pooled contrast with inverse probability weights, the confidence intervals, the pp-value and Fig. 1 are unaffected. The 19% relative increase stands as an estimate of the effect of the Michelle Obama porch condition, conditional on the assumptions about assignment, consistency and interference; the questions about assignment in 2014 and 2015 are separate from this correction, and neither the paper nor the released data settle them. What changes is the categorical campaign conclusion and the campaign-effect wording on p. 5/6. The Introduction’s proposed reminder mechanism and stated research purpose can remain, together with the explicit description of the randomized intervention and the geographic, Halloween, repeat-participation and priming qualifications. No later mathematical result depends on the campaign attribution.

Corrected

Abstract, Conclusions. These trials estimate that assignment to the implemented Michelle Obama porch condition increased the probability of choosing raisins rather than candy relative to the pooled comparison conditions. Campaign reinforcement is a possible explanation; the experiment does not establish that the initiative or its health message caused the difference. Whether the estimated porch-condition effect extends beyond Halloween trick-or-treating in New Haven, CT on the porch of an economics professor requires further research.

Results and conclusions, p. 5/6. In particular, this is a strongly Democratic neighborhood, and if children in Democratic households are either more aware of Michelle Obama’s campaign or more favorably disposed to it, we could generate an overestimate of the effect of the implemented Michelle Obama porch condition on the general population of those in the United States.
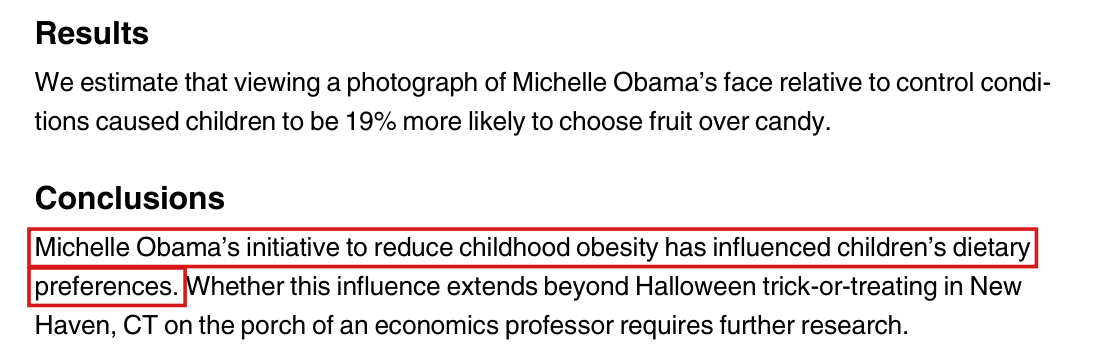

Crop of the end of the abstract. Under the heading Results, the text reads: We estimate that viewing a photograph of Michelle Obama's face relative to control conditions caused children to be 19 percent more likely to choose fruit over candy. Under the heading Conclusions, a red outline surrounds the first sentence: Michelle Obama's initiative to reduce childhood obesity has influenced children's dietary preferences. The remaining sentence of the Conclusions, on whether this influence extends beyond Halloween in New Haven, is not outlined.
Abstract, Results and Conclusions, p. 2/6 (PDF p. 2). The outline marks the first sentence of the Conclusions, which attributes the estimated effect to the initiative.
Crop of five lines from page 5. The sentence reads: In particular, this is a strongly Democratic neighborhood, and if children in Democratic households are either more aware of Michelle Obama's campaign or more favorably disposed to it, we would generate an overestimate of the treatment effect of her campaign on the general population of those in the United States. A red outline surrounds the words the treatment effect of her campaign.
Results and conclusions, second paragraph, p. 5/6 (PDF p. 5). The outline marks the phrase that calls the estimate the treatment effect of the campaign.
Two dot plots side by side under the title: Two models give the same fruit choices on each side of the porch but different effects of the campaign. The left plot, headed Observable in the experiment, the two models agree, has six rows, one for each year and side. In each row a filled blue dot for the direct-display model sits inside an open orange ring for the campaign-mediated model at the same value: 20.3 percent and 25.3 percent for the comparison and Obama sides in 2012, 21.9 and 23.6 percent in 2014, 25.5 and 31.8 percent in 2015. The right plot, headed Not observable, the two models differ, has three rows, one for each year. The blue dot for the direct-display model is at zero in every row, and the orange ring for the campaign-mediated model is at 5.0 percentage points in 2012, 1.7 in 2014 and 6.3 in 2015.
The counterexample for P035-E001, by year. Left: the probability of choosing fruit on each side of the porch, which is the same in the direct-display model (filled dot) and in the campaign-mediated model (open ring) and equals the proportion in the released data. Right: the mean effect of the campaign on fruit choice on the Obama side, which is zero in the direct-display model and 5.0, 1.7 and 6.3 percentage points in the campaign-mediated model.
My comment and the history of this entry

I think you are being far too literal in your reading of this. This is the inferred mechanism for the intervention. We are explicit that what we were randomizing, and why this is our inference from it.

Updated after decision rendered by LLMs. I continue to think this is a silly decision by the LLMs, and a warning to people using the (current iteration of) LLMs to judge severity of errors.

Suggested classification: clarity note.

My position My comment above; I suggested a clarity note.

The models’ position The abstract still attributes an effect to the initiative, and p. 5 calls the estimate a campaign effect, although the experiment is consistent with no contribution from the campaign. Major, for that narrower unsupported causal conclusion.

  1. Classification before my review (the classification when the audit was first completed, before I reviewed it): Major error.
  2. I commented and suggested a clarity note.
  3. Independent evaluation. Incorporated in part. The Introduction’s stated purpose and proposed mechanism are no longer treated as errors, and the quotation now includes the paper’s disclaimer about the nationwide campaign and its sentence on reinforcement. My suggested classification (clarity note) was not adopted.

Minor (1)

Real but inconsequential, for example a misprint that does not change a result.

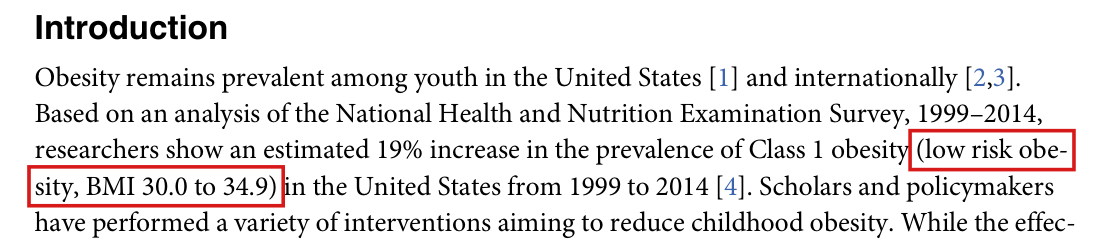
Reference [4] defines Class 1 obesity in children as BMI at or above the age- and sex-specific 95th percentile, including higher obesity classes, and not as BMI 30.0 to 34.9; the 19% increase is correct.

Introduction, first paragraph, second sentence, p. 2/6 (PDF p. 2)

As printed

Based on an analysis of the National Health and Nutrition Examination Survey, 1999–2014, researchers show an estimated 19% increase in the prevalence of Class 1 obesity (low risk obesity, BMI 30.0 to 34.9) in the United States from 1999 to 2014 [4].

The problem

The parenthetical describes Class 1 obesity by a fixed range of body mass index. Reference [4] concerns US children aged 2 to 19 and defines this class, which it writes as class I, as BMI at or above the 95th percentile for age and sex, with each weight category including the higher ones; fixed values of BMI appear in its definitions only as alternatives for classes II (35) and III (40).

Evidence a check of the printed page

The evidence is a check of the cited source, Skinner, Perrin and Skelton, Obesity 24(5):1116–1123 (2016), in the version of record. Its Methods define “obesity as ≥\ge95th percentile”, and the first footnote of its Table 1 states that “Each weight category is inclusive of the higher weight categories”. By its Table 2, the prevalence of this class was 14.6% in 1999–2000 and 17.4% in 2013–2014, which gives a relative increase of (17.4−14.6)/14.6≈0.192(17.4 - 14.6)/14.6 \approx 0.192.

What survives

The 19% increase stands, and no quantity in the trial uses this prevalence or the BMI range; the 19% in the abstract is a different quantity, the relative increase in fruit choice.

Corrected

Based on an analysis of the National Health and Nutrition Examination Survey, 1999–2014, researchers show an estimated 19% increase in the prevalence of Class 1 obesity (BMI at or above the age- and sex-specific 95th percentile, including higher obesity classes) in the United States from 1999 to 2014 [4].

Crop of the heading Introduction and the first five lines below it. The second sentence reads: Based on an analysis of the National Health and Nutrition Examination Survey, 1999 to 2014, researchers show an estimated 19 percent increase in the prevalence of Class 1 obesity (low risk obesity, BMI 30.0 to 34.9) in the United States from 1999 to 2014, with citation 4. Red outlines surround the two halves of the parenthetical, low risk obesity, BMI 30.0 to 34.9, at the end of one line and the start of the next.
Introduction, first paragraph, p. 2/6 (PDF p. 2). The outline marks the parenthetical that describes Class 1 obesity by the BMI range 30.0 to 34.9; it runs over a line break.

Clarity notes

Imprecise or ambiguous wording whose intended meaning is correct; not an error.

The paper does not say how the Clinton and no-photo conditions were allocated on the comparison side, and the released data record neither the comparison condition nor the 2015 priming assignment.

Methods, third paragraph, p. 3/6 (PDF p. 3); S1 Table

As printed

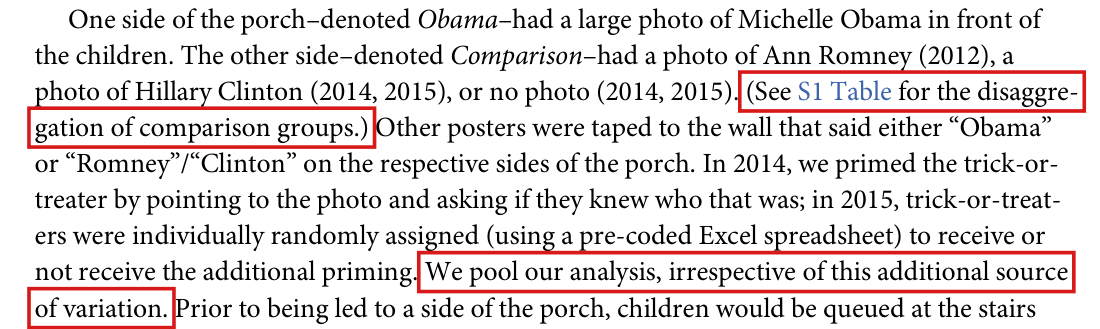
The other side–denoted Comparison–had a photo of Ann Romney (2012), a photo of Hillary Clinton (2014, 2015), or no photo (2014, 2015). (See S1 Table for the disaggregation of comparison groups.) Other posters were taped to the wall that said either “Obama” or “Romney”/“Clinton” on the respective sides of the porch. In 2014, we primed the trick-or-treater by pointing to the photo and asking if they knew who that was; in 2015, trick-or-treaters were individually randomly assigned (using a pre-coded Excel spreadsheet) to receive or not receive the additional priming. We pool our analysis, irrespective of this additional source of variation.

Intended meaning

Children were allocated to two sides of the porch. In 2014 and 2015 the comparison side had two conditions, a photograph of Hillary Clinton or no photograph, and the analysis pools these conditions and the 2015 priming assignment. This reading agrees with the page, and every entry of S1 Table is compatible with the released data. The paper does not say how or when the two conditions were allocated, and the released data record neither the comparison condition nor the priming assignment. The Clinton and No photo rows of S1 Table cannot be regenerated from the released data: in 2015, fruit counts of 55 and 58 or of 56 and 57 in these two rows both match the printed means and standard errors. The pooled estimates do not use these labels.

Corrected

(See S1 Table for the disaggregation of comparison groups. The released data record each child’s side of the porch but not the comparison condition or the 2015 priming assignment.)

A complete statement would also say how and when the Clinton and no-photo conditions were allocated on the comparison side. The published sources do not contain this information.

Crop of nine lines of the Methods, beginning One side of the porch, denoted Obama, had a large photo of Michelle Obama in front of the children. Red outlines surround two passages, each running over a line break. The first is the parenthetical: See S1 Table for the disaggregation of comparison groups. The second is the sentence: We pool our analysis, irrespective of this additional source of variation.
Methods, third paragraph, p. 3/6 (PDF p. 3). The outlines mark the pointer to S1 Table for the comparison groups and the sentence that pools the analysis over the 2015 priming assignment.

The participant with the missing outcome is excluded from the outcome regressions, and her assignment still enters the estimated treatment probabilities.

Methods, last paragraph, p. 3/6 (PDF p. 3)

As printed

(We had missing outcome data on one 12 year old, female participant in 2012; this participant is dropped from analysis. Our findings are substantively unchanged by imputing either a fruit or candy outcome for the participant.) To compute the pooled estimates, we aggregate across years using inverse probability of treatment weighting.

Intended meaning

In this parenthesis, “dropped from analysis” means that the participant is omitted from the outcome means and the outcome regressions, which use 1222 rows; the replication code does this. Her assignment still enters the estimate of the treatment probabilities, which uses all 1223 rows and gives the 2012 probability 96/16596/165 in place of 95/16495/164. The weighting method, as the paper describes it, allows this. Deleting her before the weights are estimated changes the pooled difference from 0.045414 to 0.045371 and the pp-value from 0.0908 to 0.0910, and no printed number changes.

Corrected

(We had missing outcome data on one 12 year old, female participant in 2012; this participant is excluded from the outcome regressions, while treatment probabilities are estimated using all observed assignments. Our findings are substantively unchanged by imputing either a fruit or candy outcome for the participant.)

Crop of the last five lines of page 3. The text reads: For analysis, we use the difference-in-means estimates for each year. We had missing outcome data on one 12 year old, female participant in 2012; this participant is dropped from analysis. Our findings are substantively unchanged by imputing either a fruit or candy outcome for the participant. Red outlines surround the words this participant is dropped from analysis, at the end of one line and the start of the next.
Methods, last paragraph, p. 3/6 (PDF p. 3). The outline marks the statement that the participant with the missing outcome is dropped from analysis; it runs over a line break.

Formal statements (Lean)

Formal results: 1 whole; 1 restricted; 0 refuted; 1 omitted.

Coverage concerns the identified claim under its stated assumptions. A checked proof establishes the formal statement; correspondence to the published text was reviewed by AI. Repository access is currently required to open the source links.

Each result links to its current formal statement and proof. “Whole” covers the identified claim under its assumptions; “restricted” covers the stated narrower scope; “refuted” gives a counterexample to the identified assertion; “omitted” has no current theorem. Any named published theorem used as a premise remains an assumption. Browse the formal results for this work.

Abstract, Conclusions, first sentence (the campaign attribution); the witness is the validators' construction and is not in the paper

Abstract Conclusions, p. 2/6 (PDF p. 2), and Results and conclusions, p. 5/6 (PDF p. 5); the Introduction, p. 2/6, supplies hypothesis and rationale, not a separate categorical error

Abstract Conclusions, p. 2/6, and Results and conclusions, p. 5/6. The validator's two finite worlds reproduce all six frequencies and every observed choice, but have the specified zero versus positive campaign effects, so the observed law does not identify the campaign effect. This is a witness about identification, not a decision about the initiative's actual effect; its overall mixture uses raw enrollment shares.

Historical component credits
  • Counterexample proved AronowAudit.P035.campaign_nonidentification_counterexample Historical support retained; baseline fidelity: ok; manifest: used; used in Solution; T1 explicitly asks for a validator nonidentification witness, not a full refutation of the factual empirical attribution. All clauses (i)-(v), exact constants, and granted design assumptions are exported. Rational weights cause no gap in the any-mechanism conclusion: the separately exported pointwise observed-choice equality also implies equality for arbitrary real probability weights. All sums use the finite support; all denominators are positive and natural threshold subtraction is untruncated in these instances. No status/kind inconsistency.

Abstract, Conclusions, first sentence, and 'the treatment effect of her campaign' (p. 5/6), as repaired by Sol

p. 2/6 (PDF p. 2) and p. 5/6 (PDF p. 5)

corrected Abstract Conclusions, p. 2/6, and campaign wording, p. 5/6. Two calibrated models with the same observed law have zero versus positive campaign effects, and full campaign enablement of the porch contrast is possible. Restricted to mathematical clauses (a)-(b): this does not assert the retained empirical estimate that porch assignment increased raisin choice, and it does not formalize the instruction to replace the campaign wording on p. 5/6. The counterfactual is initiative presence, with no separate health-message mediator.

Historical component credits
  • Proved AronowAudit.P035.corrected_campaign_interpretation Historical support retained; baseline fidelity: ok; manifest: used; used in Solution; Faithful to the two mathematical campaign clauses identified in T2 and claimed by this row. The fixed product masses give independent randomized assignment for every potential-outcome function; no added design hypothesis or assumed identification result is hidden in a structure. The empirical estimate sentence, separate health-message mediation, and an editorial instruction are not asserted as new population causal theorems. No status/kind inconsistency.

Abstract, Conclusions (first sentence), with Abstract, Results

Abstract Conclusions/Results, p. 2/6 (PDF p. 2), and campaign-effect wording in Results and conclusions, p. 5/6 (PDF p. 5); read with the Introduction's contextual hypothesis and rationale

No current theorem is supplied for this target.

Historical component credits
  • Not applicable Excluded association; baseline fidelity: None; manifest: not applicable; Solution use unverified; Historical excluded association.

Reproduction

What I recalculated or reran from public materials. "Agrees", "Agrees in part" or "Disagrees" compares my result with the printed one. "Not compared" means the comparison could not be made.

Status
Full reproduction of the selected headline targets
Agreement
Agrees
Reported results that were targeted
TargetWhereMethodStatusAgreement
Figure 1: pooled and yearly fruit-choice means and 95% CIsResults and conclusions, p. 4 (PDF p. 4), Figure 1I ran the authors' code with package-library and working-directory changes. The pooled means and confidence intervals agree to rounding; the six yearly points and intervals agree at the resolution of the published graph, which gives no exact annual numeric labels.ReproducedAgrees
Pooled treatment-effect significanceResults and conclusions, p. 5 (PDF p. 5), first paragraphI ran the authors' code with package-library and working-directory changes. The two-sided p-value of the pooled difference is 0.0908 (standard error 0.0269), which rounds to the printed 0.091.ReproducedTo rounding
Abstract: relative increase in fruit choiceAbstract Results, p. 2 (PDF p. 2)I calculated 100 times the ratio of the unrounded pooled means minus 100, using estimates from the authors' code. The result is 19.305%, rounding to the reported 19%; the released script does not itself calculate this ratio.RecalculatedTo rounding
Participant counts and demographicsAbstract Participants, p. 1 (PDF p. 1); Methods, pp. 2-3 (PDF pp. 2-3)I summarized counts, ages and recorded genders directly from the released data, adding calculations to the authors' analysis. All counts agree exactly and the age and male-percentage summaries agree to rounding. The released script does not calculate these summaries.RecalculatedTo rounding
