LLM-generated corrections to the published research of P. M. Aronow

Journal article P036

Corrections to: Information and Access to United Nations Diplomatic Missions

P. M. Aronow, Molly Offer-Westort, Lauren E. Pinson, and Ana C. Perez-Gea (2017). Information and Access to United Nations Diplomatic Missions. Applied Economics Letters 24(9):594–597.

DOI
10.1080/13504851.2016.1213359
Audited edition
Applied Economics Letters, 2017, 24(9):594–597; 5 pages in the audited file
SHA-256 of the audited file
e4b3716e9973d35bc5995047071681fa0cee10fb73e3578614a2bde4bc3a828b
Permanent address
https://pmaronow.github.io/llm-audit/works/P036/

Summary

The paper reports an online field experiment on the 189 UN Permanent Missions of member states with diplomatic relations with the United States. Each mission was sent by email an offer of information on peer missions (94) or on world affairs (95). Of the missions offered information on peers, 10.6% responded with interest, against 7.4% of the others, a difference of 3.3 percentage points that is not statistically significant. 4 entries are classified as errors (4 Minor), and 2 are clarity notes; 2 possible errors were not confirmed and 4 remain undetermined.

What was and was not checked

I made the following checks using the printed counts and estimates.

  • Table 1: the group sizes sum to the 189 missions (94+9594 + 95), and the percentages follow from the counts (10/94≈10.64%10/94 \approx 10.64\%, 10/95≈10.53%10/95 \approx 10.53\%, 7/95≈7.37%7/95 \approx 7.37\%). The interest responses do not exceed the any responses in either group.
  • Table 2, specification 1: coefficient 0.001120.00112 (printed 0.0010.001) with HC2 standard error 0.044990.04499 (0.0450.045), and intercept 0.105260.10526 (0.1050.105) with HC2 standard error 0.031650.03165 (0.0320.032).
  • Table 2, specification 4: coefficient 0.032700.03270 (printed 0.0330.033) with HC2 standard error 0.041810.04181 (0.0420.042), and intercept 0.073680.07368 (0.0740.074) with HC2 standard error 0.026950.02695 (0.0270.027).
  • The printed standard errors of specifications 1 and 4 agree with the HC2 estimator that the note names, and the regression without covariates reduces to the difference in means, as the paper states.
  • The text against the tables: the “0.1 percentage point” and “3.3 percentage point” differences, and “nearly 45% more” responses indicating interest, a 44.4%44.4\% increase calculated from the two rates.
  • No treatment effect in Table 2 is statistically significant at conventional two-sided levels, given the printed estimates and standard errors: the largest ratio of an estimate to its standard error is 0.790.79. Exact tests of the two unadjusted comparisons have pp-values of 1.001.00 and 0.460.46.
  • I recalculated the unadjusted logit fits from Table 1, obtaining Wald pp-values of about 0.9800.980 and 0.4340.434.
  • In all six specifications the printed coefficient b1b_1 and “Control mean” b0b_0 satisfy b0=Yˉ−b1⋅94/189b_0 = \bar Y - b_1 \cdot 94/189 within rounding, where Yˉ\bar Y is the response rate over all 189 missions. This relation holds when the covariates are centred on their sample means, and the paper does not say how they were centred.

I checked the following passages. The abstract and the Conclusion state the null result as a failure to find evidence of a difference, and not as evidence of no effect. The definition of the population, 189 missions of member states with diplomatic relations with the United States, is the same in Section II and in Section IV. I read the whole paper; it has no proofs, appendices or figures. I consulted three cited works on single points: Samii and Aronow (2012) for P036-N003, version 1.04 of the operating procedures of Lin, Green, and Coppock for the rule on missing covariate values, and Fisman and Miguel (2007) for its counts of countries and its region indicators.

I could not check the following. The experiment data and the analysis code were unavailable to me, and I identified no public archive of them. I could not recalculate the covariate-adjusted specifications 2, 3, 5 and 6, the statement on covariate balance, the coding of the responses, the imputation or the adjusted logit fits, which the paper does not present. The replication files of Fisman and Miguel could not be retrieved. The counts in Table 1, the treatment assignments and the list of 189 missions were taken as printed. I did not read the other cited works or compare the entries of the reference list with their sources; P036-E003 rests on the page alone. No appendix, supplement or published correction of the paper was identified. I have not established that the paper is correct in the respects I did not examine.

Headline claims and related corrections

  1. Offers of information on peers drew nearly 45% more responses indicating interest than offers of information on world affairs, but response rates were low in both arms and the difference is only 3.3 percentage points.

    Table 1 (interest response); Table 2, column (4)

  2. The paper describes any-response rates as low and similar in the two arms, with responses from “nearly 10%” in each arm and a difference of 0.1 percentage points.

    Table 1 (any response); Table 2, column (1)

    See P036-N009.

  3. The estimated effects of assignment to the peer treatment as compared with the world affairs treatment are not statistically significant for either outcome; the experiment therefore failed to provide evidence that these two kinds of informational offer give differential access to UN diplomats, and the hypothesis of no treatment effect cannot be rejected.

    Table 2, columns (1)-(6); Results discussion of the undisplayed logistic regressions; abstract and Conclusion

    See P036-E001, P036-E002.

  4. The null result is unchanged by adjustment for country characteristics and region indicators, and in logistic regressions.

    Table 2, columns (2), (3), (5), (6); logit results not presented

  5. Power cannot be increased by enlarging the sample, because the experiment covered the full population of Permanent Missions of UN member states with diplomatic relations with the United States (189 missions; 94 assigned to the peer treatment and 95 to the world affairs treatment).

    Section II; Section IV; Table 1, 'Countries' column

  6. Because responding is costly, variation in response rates across the two offers reveals diplomats’ preferences over additional information. Interest in peers would favor outside organizations with broad UN networks, while interest in world affairs would favor organizations with strong research capabilities.

    Introduction, pp. 594-595; Section II (wording of the two emails)

Corrections

Minor (4)

Real but inconsequential, for example a misprint that does not change a result.

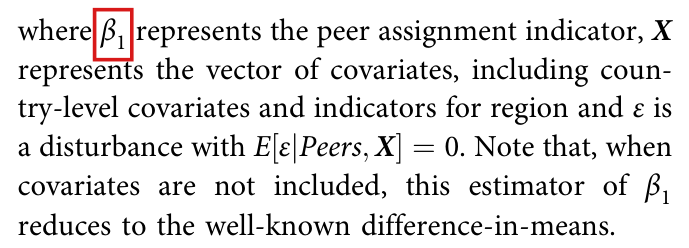
In the sentence that defines the terms of the regression model, the peer assignment indicator is Peers\mathit{Peers}, and β1\beta_1 is its coefficient.

Section III: the regression model at the foot of p. 595 (PDF p. 2), and the sentence that defines its terms, first paragraph below Table 2, p. 596 (PDF p. 3)

See also under Formal statements (Lean): P036-T1

As printed

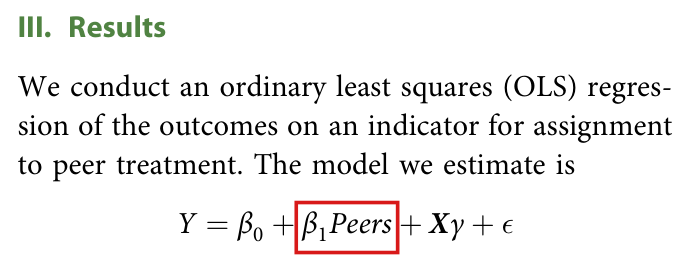
p. 595. We conduct an ordinary least squares (OLS) regression of the outcomes on an indicator for assignment to peer treatment. The model we estimate is

Y=β0+β1Peers+Xγ+ϵY = \beta_0 + \beta_1 \mathit{Peers} + \boldsymbol{X}\gamma + \epsilon

p. 596. where β1\colorbox{#ffe58a}{$\beta_1$} represents the peer assignment indicator, X\boldsymbol{X} represents the vector of covariates, including country-level covariates and indicators for region and ε\varepsilon is a disturbance with E[ε∣Peers,X]=0E[\varepsilon \mid \mathit{Peers}, \boldsymbol{X}] = 0. Note that, when covariates are not included, this estimator of β1\beta_1 reduces to the well-known difference-in-means.

The problem

In the display, β1\beta_1 multiplies Peers\mathit{Peers}. The regressor Peers\mathit{Peers} is the indicator for assignment to the peer treatment, and β1\beta_1 is its coefficient. The sentence below the display assigns the role of the indicator to β1\beta_1. The paper uses the two symbols correctly elsewhere: the same paragraph speaks of “this estimator of β1\beta_1”, and the following paragraphs call the reported value “the coefficient on the peer assignment indicator”. The intended meaning is clear from this context.

Evidence a check of the printed page

I checked the page and recalculated the two unadjusted coefficients. On the page, the display and the later phrase “the coefficient on the peer assignment indicator” fix the roles of the two symbols. With these roles, the last sentence of the passage holds. In the regression of YY on an intercept and Peers\mathit{Peers}, the two normal equations state that the residuals have mean zero in each treatment group. The fitted values are the two group means, and I have

β^0=Yˉ0,β^1=Yˉ1−Yˉ0,\hat\beta_0 = \bar Y_0, \qquad \hat\beta_1 = \bar Y_1 - \bar Y_0 ,

where Yˉ1\bar Y_1 and Yˉ0\bar Y_0 are the mean outcomes of the missions assigned to the peer treatment and to the world affairs treatment. From the counts in Table 1, I obtain β^1=10/94−10/95=1/893≈0.0011\hat\beta_1 = 10/94 - 10/95 = 1/893 \approx 0.0011 for any response and β^1=10/94−7/95=146/4465≈0.0327\hat\beta_1 = 10/94 - 7/95 = 146/4465 \approx 0.0327 for interest response. These values round to the entries 0.0010.001 and 0.0330.033 of Table 2, specifications 1 and 4.

What survives

The model, the estimates and standard errors of Table 2, and the sentence on the difference in means are unaffected. The correction changes only the wording of one definition.

Corrected

We conduct an ordinary least squares (OLS) regression of the outcomes on an indicator for assignment to peer treatment. The model we estimate is

Y=β0+β1Peers+Xγ+ϵY = \beta_0 + \beta_1 \mathit{Peers} + \boldsymbol{X}\gamma + \epsilon

where Peers\mathit{Peers} is an indicator equal to one for assignment to the peer treatment and zero for assignment to the world-affairs treatment, β1\beta_1 is its coefficient, X\boldsymbol{X} represents the vector of covariates, including country-level covariates and indicators for region and ε\varepsilon is a disturbance with E[ε∣Peers,X]=0E[\varepsilon \mid \mathit{Peers}, \boldsymbol{X}] = 0. Note that, when covariates are not included, this estimator of β1\beta_1 reduces to the well-known difference-in-means.

The change of one symbol is also sufficient: “where Peers\colorbox{#ffe58a}{$\mathit{Peers}$} represents the peer assignment indicator”.

Crop of six lines of text. The first line reads: where beta sub 1 represents the peer assignment indicator, X. The passage continues: represents the vector of covariates, including country-level covariates and indicators for region and epsilon is a disturbance with E[epsilon | Peers, X] = 0. Note that, when covariates are not included, this estimator of beta sub 1 reduces to the well-known difference-in-means. A red outline surrounds the first beta sub 1.
Section III, first paragraph below Table 2, p. 596 (PDF p. 3), left column. The outline marks β1\beta_1, which the sentence calls the peer assignment indicator.
Crop of the heading III. Results, three lines of text and a displayed equation. The text reads: We conduct an ordinary least squares (OLS) regression of the outcomes on an indicator for assignment to peer treatment. The model we estimate is. The equation reads: Y = beta sub 0 + beta sub 1 Peers + X gamma + epsilon. A red outline surrounds the product beta sub 1 Peers.
Section III, opening sentence and the regression model, foot of p. 595 (PDF p. 2), right column. The outline marks the product β1Peers\beta_1 \mathit{Peers}: in the display, β1\beta_1 multiplies the indicator Peers\mathit{Peers}. The display is correct as printed.

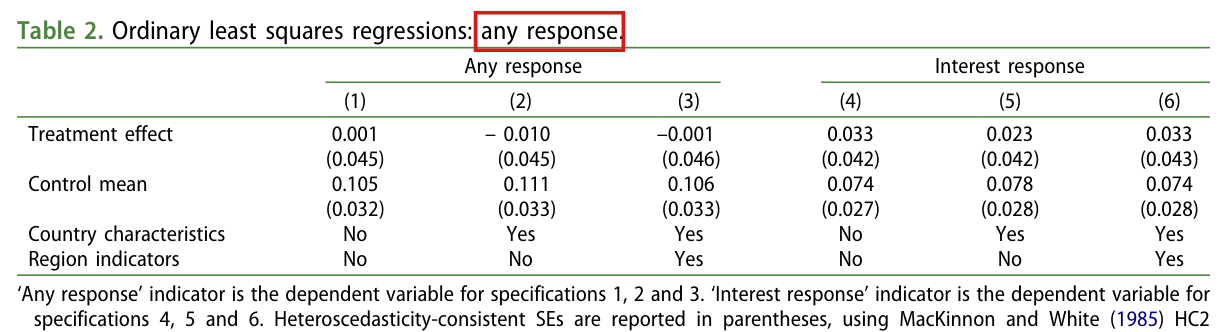
The title of Table 2 should name both outcomes of the table, any response and interest response.

Table 2, title, p. 596 (PDF p. 3)

As printed

Table 2. Ordinary least squares regressions: any response.

The problem

The title names one of the two outcomes. Specifications 1, 2 and 3 are regressions of the any-response indicator, and specifications 4, 5 and 6 are regressions of the interest-response indicator.

Evidence a check of the printed page

I checked the page. The heading “Any response” spans specifications 1, 2 and 3, the heading “Interest response” spans specifications 4, 5 and 6, and the first two sentences of the table note assign the two dependent variables in the same way.

What survives

The column headings and the note identify the outcomes correctly and need no change. No entry of the table changes.

Corrected

Table 2. Ordinary least squares regressions: any response and interest response.

Crop of Table 2. The title reads: Table 2. Ordinary least squares regressions: any response. A red outline surrounds the words any response at the end of the title. Below the title, the heading Any response spans columns (1), (2) and (3), and the heading Interest response spans columns (4), (5) and (6). The rows are Treatment effect and Control mean, each with standard errors in parentheses, Country characteristics and Region indicators. The first two lines of the note identify any response as the dependent variable for specifications 1, 2 and 3 and interest response for specifications 4, 5 and 6. The next sentence names heteroscedasticity-consistent standard errors and MacKinnon and White (1985), then is cut off after HC2.
Table 2 with the first two lines of its note, p. 596 (PDF p. 3). The outline marks “any response” in the title; the heading over specifications 4, 5 and 6 is “Interest response”.

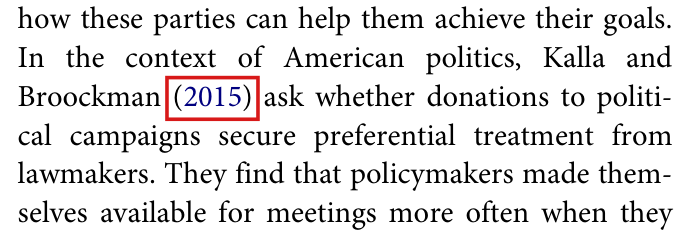
The citation of Kalla and Broockman on p. 594 should carry the year 2016, as in the reference list, and the Funding paragraph should read “authors”.

Section I, “Information and access”, first paragraph, p. 594 (PDF p. 1); References and Funding paragraph, p. 597 (PDF p. 4)

As printed

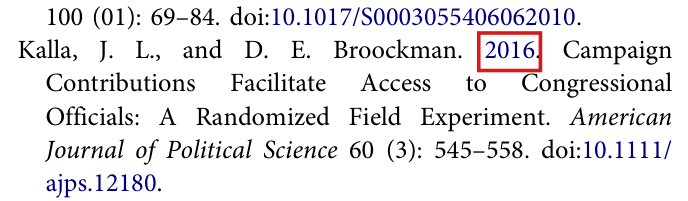
p. 594. In the context of American politics, Kalla and Broockman (2015) ask whether donations to political campaigns secure preferential treatment from lawmakers.

p. 597, References. Kalla, J. L., and D. E. Broockman. 2016. Campaign Contributions Facilitate Access to Congressional Officials: A Randomized Field Experiment. American Journal of Political Science 60 (3): 545–558. doi:10.1111/ajps.12180.

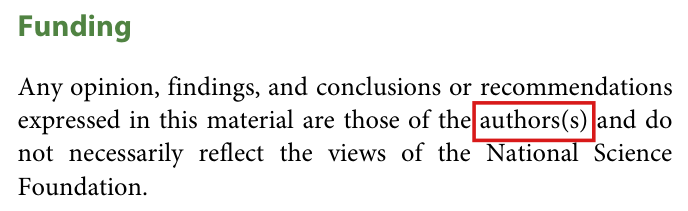
p. 597, Funding. Any opinion, findings, and conclusions or recommendations expressed in this material are those of the authors(s) and do not necessarily reflect the views of the National Science Foundation.

The problem

The text cites Kalla and Broockman with the year 2015, and the reference list has a single entry for these authors, dated 2016. The Funding paragraph prints “authors(s)” for “authors”.

Evidence a check of the printed page

I checked the citation on p. 594, and the Funding paragraph and the complete reference list on p. 597. I did not check the date on which the cited article first appeared online. The two years disagree, but this does not show that 2015 is a false date.

What survives

The cited work is identified by its title and DOI, and nothing in the paper depends on either point.

Corrected

p. 594. In the context of American politics, Kalla and Broockman (2016) ask whether donations to political campaigns secure preferential treatment from lawmakers.

p. 597, Funding. Any opinion, findings, and conclusions or recommendations expressed in this material are those of the authors and do not necessarily reflect the views of the National Science Foundation.

Crop of six lines of the left column of page 594. The text reads: how these parties can help them achieve their goals. In the context of American politics, Kalla and Broockman (2015) ask whether donations to political campaigns secure preferential treatment from lawmakers. They find that policymakers made themselves available for meetings more often when they. A red outline surrounds the year (2015).
Section I, “Information and access”, first paragraph, p. 594 (PDF p. 1), left column. The outline marks the year 2015 in the citation of Kalla and Broockman.
Crop of the reference list on page 597. After the last line of the preceding entry, the entry reads: Kalla, J. L., and D. E. Broockman. 2016. Campaign Contributions Facilitate Access to Congressional Officials: A Randomized Field Experiment. American Journal of Political Science 60 (3): 545 to 558. doi:10.1111/ajps.12180. A red outline surrounds the year 2016.
References, p. 597 (PDF p. 4), right column: the only entry for Kalla and Broockman. The outline marks its year, 2016.
Crop of the heading Funding and the four lines below it: Any opinion, findings, and conclusions or recommendations expressed in this material are those of the authors(s) and do not necessarily reflect the views of the National Science Foundation. A red outline surrounds the word authors(s), which is printed with a second s in parentheses.
Funding paragraph, p. 597 (PDF p. 4), left column. The outline marks the misprint “authors(s)”.

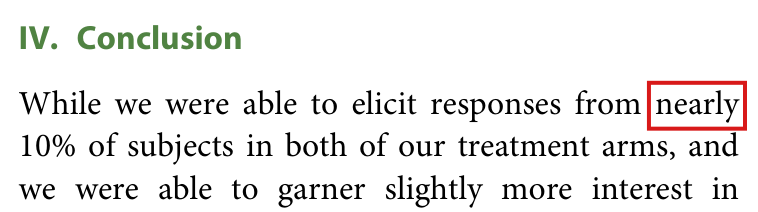
Both response rates exceed 10%, but the text says “nearly” 10%

Conclusion, printed p. 596, first clause

Classification before my review (the classification when the audit was first completed, before I reviewed it): Not confirmed (entry P036-N009).

As printed

responses from nearly 10% of subjects in both of our treatment arms

The problem

On its natural reading, “nearly 10%” means close to but below 10%. Both arms have response rates above 10%. A direction-neutral reading of “nearly” exists, but on the natural reading the word is wrong here.

Evidence a recalculation from the source

Table 1, printed p. 595, gives any-response proportions 10/9410/94 and 10/9510/95. Then 10/94≈10.64%10/94 \approx 10.64\% and 10/95≈10.53%10/95 \approx 10.53\%. Both rates exceed 10%.

What survives

This wording repair requires no change to the reported counts, percentages, treatment comparison or conclusion. Each rate is still roughly one in ten.

Corrected

responses from about 10% of subjects in both of our treatment arms

Crop of the Conclusion heading and its first three lines. A red outline surrounds nearly at the end of the first line. The next line reads 10 percent of subjects in both of our treatment arms, and; the following line begins the description of interest.
Conclusion, p. 596 (PDF p. 3), right column. The outline marks “nearly” in the description of the response rates.

Clarity notes

Imprecise or ambiguous wording whose intended meaning is correct; not an error.

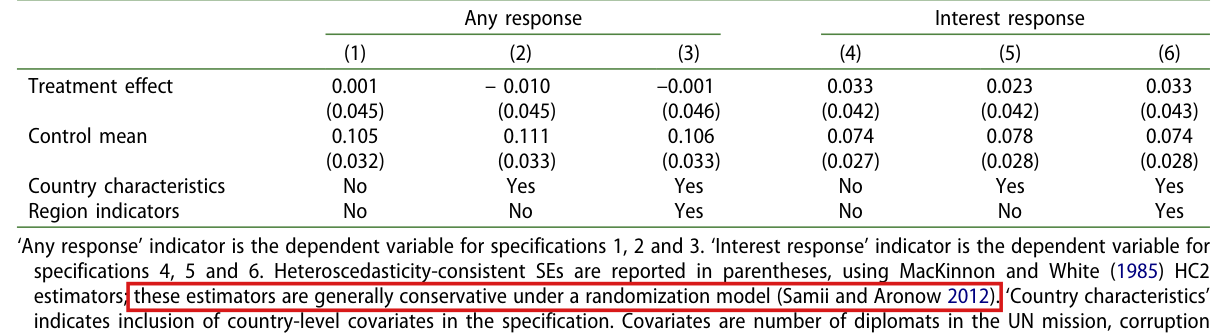
The statement in the note to Table 2 that the HC2 estimators are generally conservative is not false under its natural reading, but Samii and Aronow (2012), the paper cited for it, covers only specifications 1 and 4, which have no covariates.

Table 2, note, third sentence, p. 596 (PDF p. 3); the sentence applies to the standard errors of all six specifications

See also under Formal statements (Lean): P036-T2

As printed

Heteroscedasticity-consistent SEs are reported in parentheses, using MacKinnon and White (1985) HC2 estimators; these estimators are generally conservative under a randomization model (Samii and Aronow 2012).

Intended meaning

I read the word “generally” as a hedge: the note does not claim an exact bound at a fixed number of units for every regression, or for every assignment. For specifications 1 and 4, which have no covariates, the HC2 variance estimator for the treatment effect equals the Neyman variance estimator and is conservative in expectation under complete randomization. This is Theorem 1 and Corollary 1 of Samii and Aronow (2012). The cited paper considers the regression of the outcome on an intercept and a treatment indicator alone, and it has no result for a regression with covariates. For specifications 2, 3, 5 and 6, in which covariates enter additively, a separate derivation shows that the estimator is conservative to first order as the number of units grows, when the number of covariates is fixed and regularity conditions hold. This derivation gives no bound at a fixed number of units, and it is not established that its conditions hold in the present application. Read in this way, the statement is not false, and the citation supports it for specifications 1 and 4 only. No estimate, standard error or conclusion of the paper depends on the citation.

Corrected

Heteroscedasticity-consistent SEs are reported in parentheses, using MacKinnon and White (1985) HC2 estimators; for specifications 1 and 4, the variance estimator for the treatment effect is conservative in expectation under complete randomization (Samii and Aronow 2012).

A statement about specifications 2, 3, 5 and 6 would need a separate result, cited with its conditions.

Crop of Table 2 below its title. The heading Any response spans columns (1) to (3), and the heading Interest response spans columns (4) to (6). The rows are Treatment effect and Control mean, each with standard errors in parentheses, then Country characteristics, with entries No, Yes, Yes, No, Yes, Yes, and Region indicators, with entries No, No, Yes, No, No, Yes. In the note below the table, a red outline surrounds the words: these estimators are generally conservative under a randomization model (Samii and Aronow 2012). The words before the outline read: ``Heteroscedasticity-consistent SEs are reported in parentheses, using MacKinnon and White (1985) HC2 estimators;''.
Table 2 below its title, with the first four lines of its note, p. 596 (PDF p. 3). The outline marks the statement that the HC2 estimators are generally conservative under a randomization model, with its citation. The rows “Country characteristics” and “Region indicators” show that specifications 2, 3, 5 and 6 include covariates.

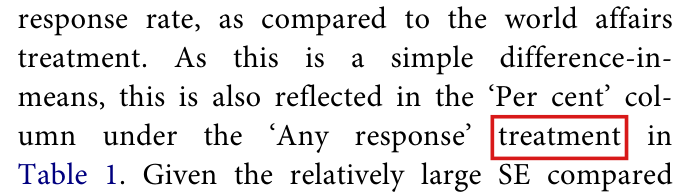
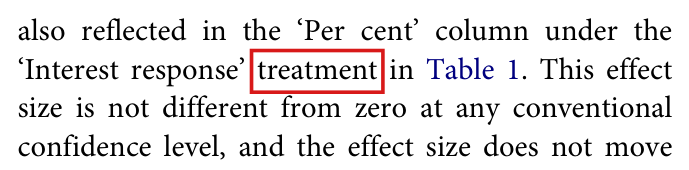
In two cross-references to Table 1, “treatment” means the outcome heading: “Any response” and “Interest response” are the two outcomes, and the treatments are the rows Peers and World affairs.

Section III, p. 596 (PDF p. 3): third paragraph on the page, left column, and the fourth paragraph where it continues at the top of the right column

As printed

As this is a simple difference-in-means, this is also reflected in the ‘Per cent’ column under the ‘Any response’ treatment in Table 1. […] This is also reflected in the ‘Per cent’ column under the ‘Interest response’ treatment in Table 1.

Intended meaning

The two phrases point to the ‘Per cent’ columns under the headings ‘Any response’ and ‘Interest response’ of Table 1. In that table the treatment groups are the rows, Peers and World affairs, and the two headings are the outcomes that Section II defines. The intended columns are clear, and what the two sentences say about them is correct: the differences between the ‘Per cent’ entries are the 0.1 and 3.3 percentage points of specifications 1 and 4.

Corrected

As this is a simple difference-in-means, this is also reflected in the ‘Per cent’ column under the ‘Any response’ heading in Table 1. […] This is also reflected in the ‘Per cent’ column under the ‘Interest response’ heading in Table 1.

Crop of five lines of text: response rate, as compared to the world affairs treatment. As this is a simple difference-in-means, this is also reflected in the ‘Per cent’ column under the ‘Any response’ treatment in Table 1. Given the relatively large SE compared. A red outline surrounds the word treatment that follows ‘Any response’.
Section III, third paragraph on p. 596 (PDF p. 3), left column. The outline marks “treatment” in the cross-reference to the “Any response” columns of Table 1.
Crop of four lines of text: also reflected in the ‘Per cent’ column under the ‘Interest response’ treatment in Table 1. This effect size is not different from zero at any conventional confidence level, and the effect size does not move. A red outline surrounds the word treatment that follows ‘Interest response’.
Section III, top of the right column, p. 596 (PDF p. 3). The outline marks “treatment” in the cross-reference to the “Interest response” columns of Table 1.

Formal statements (Lean)

Formal results: 2 whole; 0 restricted; 0 refuted; 0 omitted.

Coverage concerns the identified claim under its stated assumptions. A checked proof establishes the formal statement; correspondence to the published text was reviewed by AI. Repository access is currently required to open the source links.

Each result links to its current formal statement and proof. “Whole” covers the identified claim under its assumptions; “restricted” covers the stated narrower scope; “refuted” gives a counterexample to the identified assertion; “omitted” has no current theorem. Any named published theorem used as a premise remains an assumption. Browse the formal results for this work.

Section III, the regression model and the sentence defining its terms (“where β1\beta_1 represents the peer assignment indicator”), corrected: PeersPeers is the indicator and β1\beta_1 its coefficient, whose OLS estimator without covariates is the difference in means

pp. 595-596 (PDF pp. 2-3): the display at the foot of the right column of p. 595; the defining sentence at the top of the left column of p. 596, below Table 2

Section III, pp. 595–596 (PDF pp. 2–3), with Table 1 on p. 595 and Table 2 columns (1) and (4) on p. 596. With Peers as the indicator and β₁ its coefficient, the zero-conditional-mean models give the stated conditional means, unadjusted OLS has the unique arm-mean minimizer, and the two response-count inputs give the exact and rounded coefficients printed in the tables.

Historical component credits
  • Proved AronowAudit.P036.conditional_mean_of_model Historical support retained; baseline fidelity: ok; manifest: used; used in Solution; The corrected model theorem already applies this general conditional-expectation helper.
  • Proved AronowAudit.P036.corrected_model_conditional_mean Historical support retained; baseline fidelity: ok; manifest: used; used in Solution; The target itself explicitly requires integrable disturbance and covariate contribution. Random-variable measurability is conventional here, and in the finite empirical setting it costs no cases; k=0 and zero-probability arms are permitted. No claim-stage verdict or severity changed after reading the record.
  • Proved AronowAudit.P036.unadjusted_conditional_means Historical support retained; baseline fidelity: ok; manifest: used; used in Solution; This is the population conditional-mean part of T1(i), not the sample OLS identity of T1(ii). Both conclusions are exported, and no problematic division or integral convention is used. No claim-stage verdict or severity changed after reading the record.
  • Proved AronowAudit.P036.peers_binary Historical support retained; baseline fidelity: ok; manifest: used; used in Solution; {'source': 'adjudication', 'decision': 'rejected', 'what': "P036/P036_Unadjusted.lean:224 states that peers s i equals zero or one, with peers defined at line 38 as the real membership indicator of the peer arm. This exactly matches T1(i)'s corrected statement that Peers is the binary assignment indicator. Every binary assignment is represented by its set of ones, so the encoding excludes no assignments and requires no additional hypothesis. The definitional coding is the content of this component, not a material discrepancy or a degenerate convention."}
  • Proved AronowAudit.P036.interest_is_subset Historical support retained; baseline fidelity: ok; manifest: not used; not used in Solution; The outcome-subset helper is not an additional conclusion of the corrected regression claim.
  • Proved AronowAudit.P036.sum_peers Historical support retained; baseline fidelity: ok; manifest: used; used in Solution; The set and its finite complement give the two assignment arms. No randomization law is required to identify the realized arm size. No claim-stage verdict or severity changed after reading the record.
  • Proved AronowAudit.P036.arm_centered_sum Historical support retained; baseline fidelity: ok; manifest: used; used in Solution; The existing least-squares minimizer theorem already incorporates this centered-sum identity.
  • Proved AronowAudit.P036.arm_square_decomposition Historical support retained; baseline fidelity: ok; manifest: used; used in Solution; The existing least-squares minimizer theorem already incorporates this square decomposition.
  • Proved AronowAudit.P036.rss_partition Historical support retained; baseline fidelity: ok; manifest: used; used in Solution; This partition is already used inside the credited least-squares minimizer theorem.
  • Proved AronowAudit.P036.rss_decomposition Historical support retained; baseline fidelity: ok; manifest: used; used in Solution; This decomposition is already used inside the credited least-squares minimizer theorem.
  • Proved AronowAudit.P036.ols_unique_minimizer Historical support retained; baseline fidelity: ok; manifest: used; used in Solution; The right side is an explicitly defined pair, not a structure carrying minimization as a field. Substituting that pair into the biconditional establishes existence as well as uniqueness; the two nonempty-arm hypotheses are in the target. No claim-stage verdict or severity changed after reading the record.
  • Proved AronowAudit.P036.table_any_coefficients Historical support retained; baseline fidelity: ok; manifest: used; used in Solution; {'source': 'adjudication', 'decision': 'rejected', 'what': "P036/P036_Unadjusted.lean:389 evaluates tableCoefficients 10 10 as (2/19, 1/893); its definition at line 384 is (k₀/95, k₁/94 − k₀/95). These are precisely T1(iii)'s any-response intercept 10/95 and peer coefficient 10/94 − 10/95, using the counts and arm sizes expressly supplied by Table 1. The OLS interpretation agrees with olsCoefficients at line 219 and the global-minimizer characterization at line 349. This row covers the numerical instance, so using sufficient statistics instead of mission-level data neither narrows its domain nor omits a claimed conclusion."}
  • Proved AronowAudit.P036.table_interest_coefficients Historical support retained; baseline fidelity: ok; manifest: used; used in Solution; {'source': 'adjudication', 'decision': 'rejected', 'what': "P036/P036_Unadjusted.lean:395 evaluates tableCoefficients 10 7 as (7/95, 146/4465), with intercept first and peer coefficient second. By the definition at line 384, these are exactly 7/95 and 10/94 − 7/95, matching T1(iii)'s interest-response instance and the printed Table 1 counts. The general OLS coefficient definition at line 219 and minimizer characterization at line 349 supply the stated interpretation, while this row establishes the exact arithmetic component. The sufficient-statistic representation adds no restriction or material mismatch."}
  • Proved AronowAudit.P036.table_coefficient_rounding Historical support retained; baseline fidelity: ok; manifest: used; used in Solution; The four target entries and their order agree. The definition does not require nonnegative x or a decimal grid for every possible argument, but the four concrete uses have both properties. No claim-stage verdict or severity changed after reading the record.

Table 2, note, third sentence (the HC2 standard errors “are generally conservative under a randomization model (Samii and Aronow 2012)”), restricted to specifications (1) and (4): the HC2 variance estimator equals the Neyman estimator and is conservative in expectation under complete randomization

p. 596 (PDF p. 3), note to Table 2, third sentence

corrected note to Table 2, p. 596 (PDF p. 3), and the counts in Table 1, p. 595 (PDF p. 2). For unadjusted specifications under complete randomization with fixed potential outcomes and at least two units per arm, the genuine HC2 sandwich equals the Neyman estimator, the OLS and variance moments have the stated exact formulas, its nonnegative expectation gap vanishes exactly for constant unit effects, and the two count inputs give the exact variances and rounded standard errors.

Historical component credits
  • Proved AronowAudit.P036.armSS_formula Historical support retained; baseline fidelity: ok; manifest: used; used in Solution; The binary-variance and design-variance results already incorporate this finite square expansion.
  • Proved AronowAudit.P036.binary_sample_variance Historical support retained; baseline fidelity: ok; manifest: used; used in Solution; This row proves the general binary sample-variance subclaim in T2(e), not the numerical table values or their rounding. Binary values and the count imply 0≤k≤|s|. Claim-stage verdict unchanged after reading record.json.
  • Proved AronowAudit.P036.gram_entries Historical support retained; baseline fidelity: ok; manifest: used; used in Solution; Entrywise real functions on Fin 2 represent the same 2×2 Gram matrix; all target cases are included. The claim-stage verdict is unchanged after reading the record.
  • Proved AronowAudit.P036.gram_inverse Historical support retained; baseline fidelity: ok; manifest: used; used in Solution; The inverse is a displayed candidate matrix, but both inverse equalities are conclusions, not fields of an assumed contract. The claim-stage verdict is unchanged after reading the record.
  • Proved AronowAudit.P036.sum_peers_mul Historical support retained; baseline fidelity: ok; manifest: used; used in Solution; The existing matrix OLS coefficient theorem already incorporates this regressor-total identity.
  • Proved AronowAudit.P036.matrix_ols_coefficients Historical support retained; baseline fidelity: ok; manifest: used; used in Solution; The covered component is T2(a)'s coefficient identity. OLS minimization and uniqueness are separate facts, so this algebraic extension is not a uniqueness claim for singular designs. The claim-stage verdict is unchanged after reading the record.
  • Proved AronowAudit.P036.leverage_by_arm Historical support retained; baseline fidelity: ok; manifest: used; used in Solution; The arm containing i is automatically nonempty, so the selected reciprocal never divides by zero; the target's two-arm inverse interpretation is valid. The claim-stage verdict is unchanged after reading the record.
  • Proved AronowAudit.P036.residual_by_arm Historical support retained; baseline fidelity: ok; manifest: used; used in Solution; The existing HC2 sandwich and Neyman-identity proofs already incorporate this residual formula.
  • Proved AronowAudit.P036.hc2_arm_formula Historical support retained; baseline fidelity: ok; manifest: used; used in Solution; On target designs the sandwich is genuine: both arms have size at least two, B is the Gram inverse, and 1−hᵢ>0; the extra totalized cases do not alter this specialization. The claim-stage verdict is unchanged after reading the record.
  • Proved AronowAudit.P036.hc2_eq_neyman Historical support retained; baseline fidelity: ok; manifest: used; used in Solution; This row covers exactly T2(b)'s final HC2/Neyman equality for the unadjusted coefficient; it does not itself assert conservativeness or adjusted-regression results. The claim-stage verdict is unchanged after reading the record.
  • Proved AronowAudit.P036.table_any_hc2 Historical support retained; baseline fidelity: ok; manifest: used; used in Solution; This row evaluates the sufficient-statistic expression. R216-11 connects it to the genuine HC2 sandwich for every binary array with the paper’s arm sizes and counts, so no estimator identification is merely assumed.
  • Proved AronowAudit.P036.table_interest_hc2 Historical support retained; baseline fidelity: ok; manifest: used; used in Solution; This row evaluates the interest-response sufficient-statistic expression. R216-11 supplies its equality to the genuine HC2 sandwich on every binary dataset with the relevant arm sizes and counts.
  • Proved AronowAudit.P036.table_from_binary_counts Historical support retained; baseline fidelity: ok; manifest: used; used in Solution; The fixed 94/95 sizes and binary outcomes are exactly the paper-instance component this row covers, not a restriction on the general T2 claims. Counts remain arbitrary; the numerical companion rows specialize them to 10/10 and 10/7.
  • Proved AronowAudit.P036.table_hc2_se_rounding Historical support retained; baseline fidelity: ok; manifest: used; used in Solution; The half-open intervals implement rounding to three decimals, with ties upward; neither constant is at a boundary. This says nothing about conservativeness of expected standard errors. The supplied public description states the same two treatment-coefficient rounding facts.
  • Proved AronowAudit.P036.assignments_card Historical support retained; baseline fidelity: ok; manifest: used; used in Solution; The assembled randomization-moment proofs already incorporate this design-counting fact.
  • Proved AronowAudit.P036.assignments_nonempty Historical support retained; baseline fidelity: ok; manifest: used; used in Solution; The assembled randomization-moment proofs already establish nonempty averaging support.
  • Proved AronowAudit.P036.single_inclusion_count Historical support retained; baseline fidelity: ok; manifest: used; used in Solution; The assembled moment proofs already incorporate this single-counting fact.
  • Proved AronowAudit.P036.pair_inclusion_count Historical support retained; baseline fidelity: ok; manifest: used; used in Solution; The assembled moment proofs already incorporate this pair-counting fact.
  • Proved AronowAudit.P036.expected_peer_indicator Historical support retained; baseline fidelity: ok; manifest: used; used in Solution; The assembled moment results already incorporate this single-inclusion expectation.
  • Proved AronowAudit.P036.expected_peer_pair Historical support retained; baseline fidelity: ok; manifest: used; used in Solution; The assembled moment results already incorporate this pair-inclusion expectation.
  • Proved AronowAudit.P036.expected_sample_total Historical support retained; baseline fidelity: ok; manifest: used; used in Solution; The assembled moment results already incorporate this sample-total first moment.
  • Proved AronowAudit.P036.weighted_pair_sum Historical support retained; baseline fidelity: ok; manifest: used; used in Solution; The assembled second-moment proof already incorporates this weighted pair-sum identity.
  • Proved AronowAudit.P036.expected_sample_total_sq Historical support retained; baseline fidelity: ok; manifest: used; used in Solution; The assembled variance result already incorporates this sample-total second moment.
  • Proved AronowAudit.P036.armMean_congr Historical support retained; baseline fidelity: ok; manifest: used; used in Solution; Arm-mean locality is already incorporated in the assembled observed-outcome moment proofs.
  • Proved AronowAudit.P036.sampleVariance_congr Historical support retained; baseline fidelity: ok; manifest: used; used in Solution; Variance locality is already incorporated in the assembled observed-outcome moment proofs.
  • Proved AronowAudit.P036.observed_arm_quantities Historical support retained; baseline fidelity: ok; manifest: used; used in Solution; The assembled moment results already incorporate observed-outcome locality within each arm.
  • Proved AronowAudit.P036.expected_sample_mean Historical support retained; baseline fidelity: ok; manifest: used; used in Solution; Sample-mean unbiasedness is already incorporated in complete_randomization_moments.
  • Proved AronowAudit.P036.expected_sample_variance Historical support retained; baseline fidelity: ok; manifest: used; used in Solution; Both-arm sample-variance unbiasedness is already included in complete_randomization_moments.
  • Proved AronowAudit.P036.design_complement Historical support retained; baseline fidelity: ok; manifest: used; used in Solution; The assembled two-arm moment results already incorporate the complement-design identity.
  • Proved AronowAudit.P036.randomization_unbiased_effect Historical support retained; baseline fidelity: ok; manifest: used; used in Solution; This conclusion is included directly in complete_randomization_moments.
  • Proved AronowAudit.P036.randomization_unbiased_variances Historical support retained; baseline fidelity: ok; manifest: used; used in Solution; Both conclusions are included directly in complete_randomization_moments.
  • Proved AronowAudit.P036.designVariance_second_moment Historical support retained; baseline fidelity: ok; manifest: used; used in Solution; The assembled design-variance proof already incorporates this second-moment expansion.
  • Proved AronowAudit.P036.designVariance_sub_const Historical support retained; baseline fidelity: ok; manifest: used; used in Solution; The assembled design-variance proof already incorporates translation invariance.
  • Proved AronowAudit.P036.designVariance_congr Historical support retained; baseline fidelity: ok; manifest: used; used in Solution; Variance transport is already incorporated in the assembled randomization-variance identity.
  • Proved AronowAudit.P036.sample_total_variance Historical support retained; baseline fidelity: ok; manifest: used; used in Solution; The assembled randomization-variance theorem already incorporates the sample-total variance.
  • Proved AronowAudit.P036.sum_linear_combination_sq Historical support retained; baseline fidelity: ok; manifest: used; used in Solution; The assembled design-variance proof already incorporates this finite square expansion.
  • Proved AronowAudit.P036.randomization_variance_identity Historical support retained; baseline fidelity: ok; manifest: used; used in Solution; This conclusion is included directly in complete_randomization_moments.
  • Proved AronowAudit.P036.complete_randomization_moments Historical support retained; baseline fidelity: ok; manifest: used; used in Solution; Exactly T2(c) and the two sample-variance equalities in T2(d). The definition of estimatedEffect is the difference in observed arm means; its matrix/OLS identification is a separate credited bridge in this split target. Claim-stage verdict unchanged after reading record.json.
  • Proved AronowAudit.P036.expected_hc2_variance Historical support retained; baseline fidelity: ok; manifest: used; used in Solution; The HC2 object is the expanded sandwich, with explicitly specified Gram inverse, residuals, and leverages; the expectation equality is not part of its definition. The matrix/OLS bridge and pointwise HC2/Neyman equality are credited elsewhere in the split target. Claim-stage verdict unchanged after reading record.json.
  • Proved AronowAudit.P036.populationVariance_nonneg Historical support retained; baseline fidelity: ok; manifest: used; used in Solution; The exact HC2 conservativeness theorem already incorporates population-variance nonnegativity.
  • Proved AronowAudit.P036.populationVariance_zero_iff_constant Historical support retained; baseline fidelity: ok; manifest: used; used in Solution; The exact HC2 conservativeness theorem already includes the constant-effect equality criterion.
  • Proved AronowAudit.P036.corrected_hc2_conservativeness Historical support retained; baseline fidelity: ok; manifest: used; used in Solution; Exactly the corrected T2(d): a statement about expected estimated variance in the unadjusted model. The target itself supplies complete randomization and n₁,n₀≥2. No assertion about each realized variance or expected standard errors is exported. Claim-stage verdict unchanged after reading record.json.

Reproduction

What I recalculated or reran from public materials. "Agrees", "Agrees in part" or "Disagrees" compares my result with the printed one. "Not compared" means the comparison could not be made.

Status
Selected recalculation
Agreement
Agrees
Reported results that were targeted
TargetWhereMethodStatusAgreement
Table 1: response percentagesp. 595 (PDF p. 2)own recalculation from reported numbersRecalculatedTo rounding
Table 2: unadjusted OLS, columns 1 and 4p. 596 (PDF p. 3)own recalculation from reported numbersRecalculatedTo rounding
Table 2: adjusted OLS, columns 2, 3, 5 and 6p. 596 (PDF p. 3)inspectionBlockedNot compared
Abstract and results: relative interest increase and percentage-point effectsp. 594 abstract (PDF p. 1); p. 596 results and conclusion (PDF p. 3)own recalculation from reported numbersRecalculatedTo rounding
In-text logistic robustness claimp. 596 results (PDF p. 3), right columnFull claim not compared: adjusted logit outputs, experiment data and analysis code unavailable; unadjusted logits recalculated from Table 1BlockedNot compared