Assumptions and verification
Claim revision: catalog:8109edc9b4cb1397fa20152382fc46938f149945418f5f4225ad0448ecef9a9a
Standing assumptions: The article is a three-page short report (BMC Research Notes (2016) 9:341; the first page is unnumbered and the others are headed ‘Page 2 of 3’ and ‘Page 3 of 3’, so the printed page number equals the PDF page number). It states no theorem, proposition or lemma, displays no formula and gives no proof; its only formal objects are the relative-risk statistic, the empirical null distribution with its two-tailed $P$ value, and the Wald-type interval, all defined in words. The setting, as printed (read from the page images):
(S1) The statistic (Methods, p. 1): “RT used data collected from the Fatality Analysis Reporting System over the years 1975–2006. The primary analysis computed a relative risk by taking the number of persons in fatal crashes during election hours on presidential election days from 1976 through 2004, and comparing this to the average of the number of individuals in fatal crashes during the same hours one week before and one week after. We henceforth refer to RT’s test statistic—the risk relative to the same time period in the previous and following week—as the RR (relative risk).” (footnote mark 1) “Throughout, in the interest of replication, we will use RT’s test statistic as our basis for inference.” “Following a finding reported in a later article by Redelmeier and Tibshirani [2], we estimate RRs during non-election hours as well as during the full 24 h on presidential election days.”
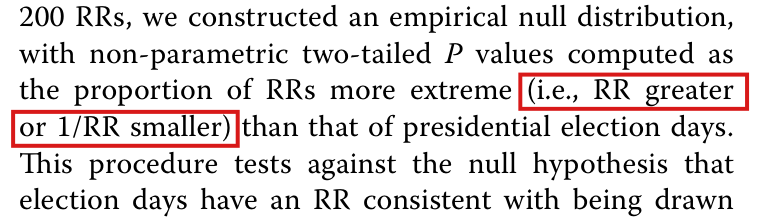
(S2) The empirical null distribution, the $P$ value and the interval (Methods, Page 2 of 3): “To assess statistical significance, we estimated RRs for the 100 Tuesdays before and after presidential election days. (We restrict ourselves to Tuesdays as all United States presidential elections are held on Tuesdays, thus conditioning on any day-of-week effects.) Using these 200 RRs, we constructed an empirical null distribution, with non-parametric two-tailed $P$ values computed as the proportion of RRs more extreme (i.e., RR greater or 1/RR smaller) than that of presidential election days. This procedure tests against the null hypothesis that election days have an RR consistent with being drawn randomly from the distribution of Tuesdays [3]. We further calculated 95 % Wald-type confidence intervals (CIs) under a normal approximation using the standard deviation of the empirical null distribution as an estimate of the standard error. Throughout, we consider only presidential elections from 1980 through 2008, as data were not available before 1975 or after 2012, precluding estimation for all Tuesdays surrounding the 1976 or 2012 elections.”
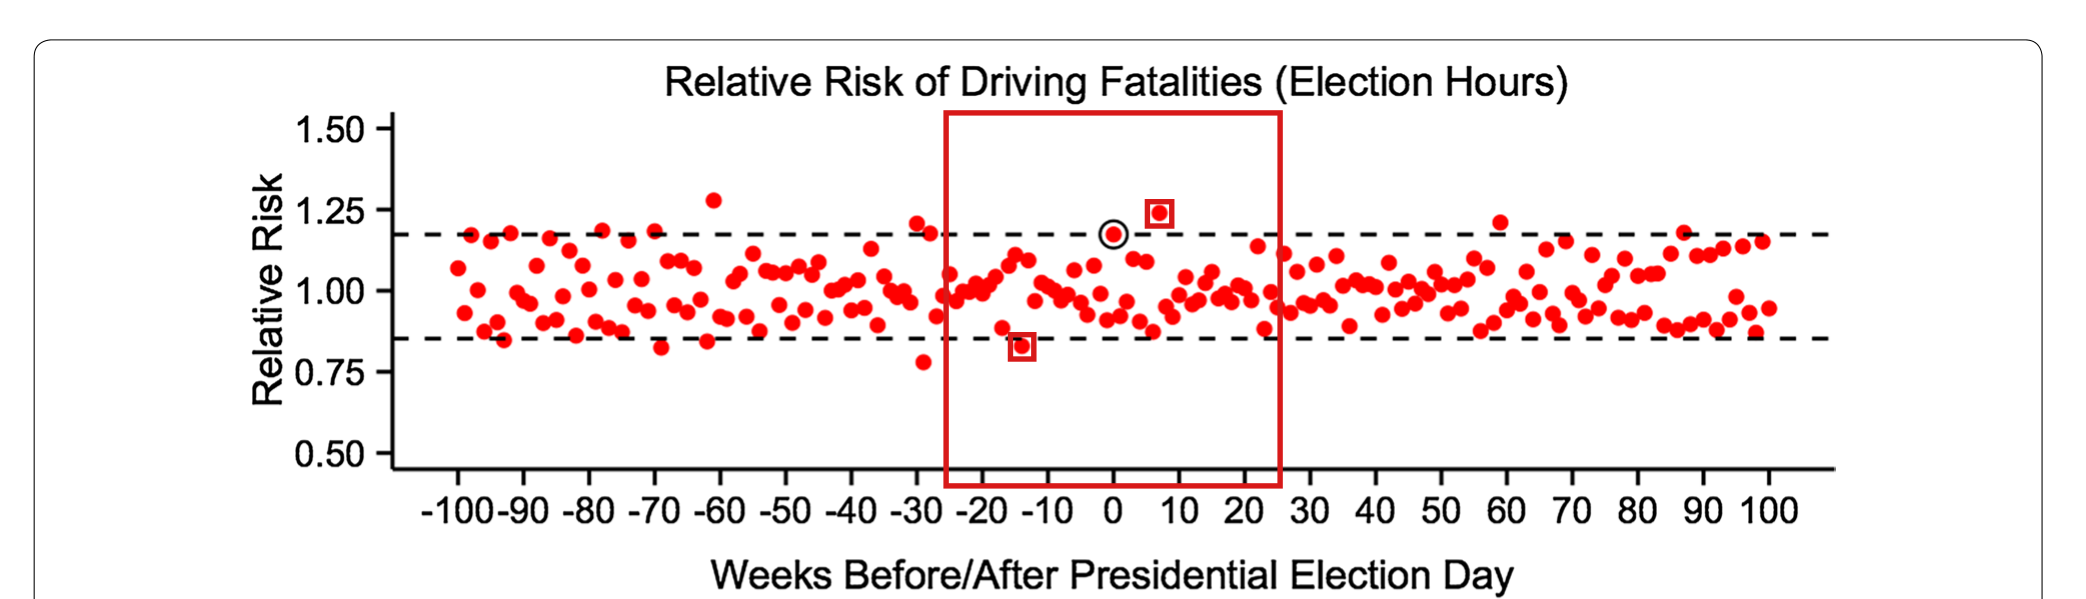
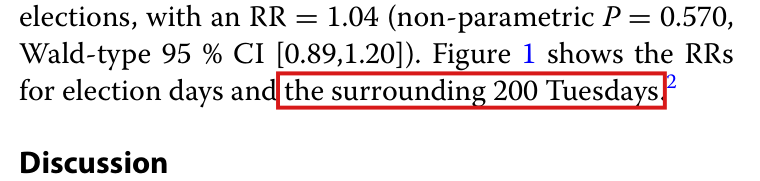
(S3) Fig. 1 (Page 2 of 3): three panels, titled “Relative Risk of Driving Fatalities (Election Hours)”, “Relative Risk of Driving Fatalities (Non-Election Hours)” and “Relative Risk of Driving Fatalities (Full 24 Hours)”, each with vertical axis “Relative Risk” (ticks 0.50, 0.75, 1.00, 1.25, 1.50) and horizontal axis “Weeks Before/After Presidential Election Day” (ticks −100 to 100 in steps of 10). Caption: “Fig. 1 Relative risk (RR) estimates for presidential election days and the 100 preceding and following Tuesdays. Red dots indicate RRs for all Tuesdays. Black circles indicate RRs and black dashed lines indicate RR and 1/RR for presidential election days. The proportion of red dots outside black dashed lines is equivalent to the reported non-parametric $P$ value”.
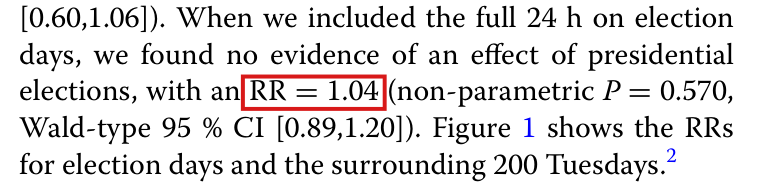
(S4) The main results (Results, Page 3 of 3): “We estimate an RR for election hours during presidential elections from 1980 to 2008 of 1.17 (non-parametric $P = 0.070$, Wald-type 95 % CI [0.99,1.35]).” “Furthermore, we estimate an equally strong negative effect of presidential elections on driving fatalities during non-election hours on election days, with an RR = 0.83 (non-parametric $P = 0.085$, Wald-type 95 % CI [0.60,1.06]). When we included the full 24 h on election days, we found no evidence of an effect of presidential elections, with an RR = 1.04 (non-parametric $P = 0.570$, Wald-type 95 % CI [0.89,1.20]). Figure 1 shows the RRs for election days and the surrounding 200 Tuesdays.” (footnote mark 2).
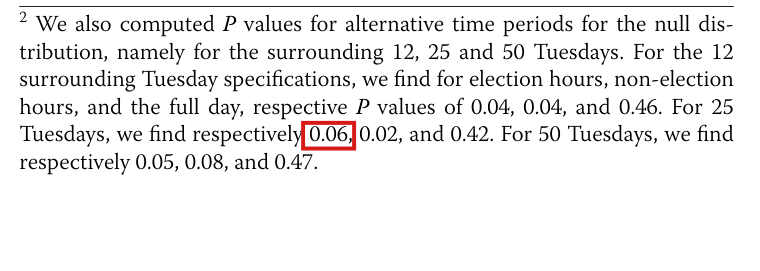
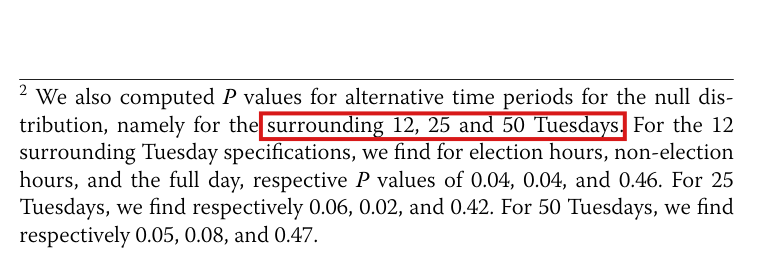
(S5) Alternative null windows (footnote 2, Page 3 of 3): “We also computed $P$ values for alternative time periods for the null distribution, namely for the surrounding 12, 25 and 50 Tuesdays. For the 12 surrounding Tuesday specifications, we find for election hours, non-election hours, and the full day, respective $P$ values of 0.04, 0.04, and 0.46. For 25 Tuesdays, we find respectively 0.06, 0.02, and 0.42. For 50 Tuesdays, we find respectively 0.05, 0.08, and 0.47.”
Not in the paper or the staged sources: the FARS counts, the plotted RR values as numbers, and any code (the staged manifest records the FARS data as unavailable and no replication code). Every statement below about which reference Tuesdays are ‘more extreme’ is therefore a statement about the published Fig. 1, not about the source data.
Effective claim (source TeX): [Printed; footnote 2, Page 3 of 3] “We also computed $P$ values for alternative time periods for the null distribution, namely for the surrounding 12, 25 and 50 Tuesdays. For the 12 surrounding Tuesday specifications, we find for election hours, non-election hours, and the full day, respective $P$ values of 0.04, 0.04, and 0.46. For 25 Tuesdays, we find respectively 0.06, 0.02, and 0.42. For 50 Tuesdays, we find respectively 0.05, 0.08, and 0.47.” The value at issue is the first of the third sentence: the election-hours $P$ value for the 25-Tuesday window, printed 0.06. [Printed; Fig. 1 caption, Page 2 of 3] “The proportion of red dots outside black dashed lines is equivalent to the reported non-parametric $P$ value”.
[Corrected; Sol's smallest_repair, validated.json, P038-N005, verbatim] “Reconcile footnote 2 and Figure 1 against the final data. If Figure 1 is correct, replace the first 25-week value, 0.06, with 0.04. If 0.06 is the verified final-data result, correct the figure to show the requisite third tail point and any other affected plotted quantities; its identity cannot be determined from the staged sources.” Under the first branch the third sentence of footnote 2 reads: “For 25 Tuesdays, we find respectively 0.04, 0.02, and 0.42.”
[Mathematical content, with every hypothesis] Notation (not in the paper). Fix one time-of-day category (here election hours). Let $R > 0$ be the election-day RR and, for each integer $w$ with $1 \le |w| \le 100$, let $r_w > 0$ be the RR of the Tuesday $w$ weeks after ($w > 0$) or $-w$ weeks before ($w < 0$) election day. For an integer $m$ with $1 \le m \le 100$ put $W_m = \{w \in \mathbb{Z} : 1 \le |w| \le m\}$, so that $|W_m| = 2m$ and week $0$ is not in $W_m$. Call $r_w$ more extreme than $R$ when it lies outside the dashed lines of Fig. 1, that is, when $r_w < \min(R, 1/R)$ or $r_w > \max(R, 1/R)$. Put $T = \{w : r_w \text{ is more extreme than } R\}$, $k_m = |T \cap W_m|$ and $$P_m = \frac{k_m}{2m}.$$ The main specification is $m = 100$ (200 RRs); footnote 2 is read as $m = 12, 25, 50$ (24, 50 and 100 RRs). A two-decimal number $v$ is the rounding of $x$ when $v - \tfrac{1}{200} \le x < v + \tfrac{1}{200}$.
(i) [The value the figure gives] For every $R > 0$ and every family $(r_w)_{w \in W_{25}}$ of positive reals of which exactly two are more extreme than $R$ (that is, $k_{25} = 2$), $$P_{25} = \frac{2}{50} = \frac{1}{25} = 0.04 .$$
(ii) [What the printed value requires] For every integer $k$ with $0 \le k \le 50$: $\frac{k}{50} = \frac{6}{100}$ if and only if $k = 3$; $\frac{k}{50}$ rounds to $0.06$ if and only if $k = 3$; and $\frac{k}{50}$ rounds to $0.04$ if and only if $k = 2$. Consequently $P_{25}$ equals (equivalently, rounds to) the printed $0.06$ if and only if exactly three of the fifty reference RRs are more extreme than $R$, and equals $0.04$ if and only if exactly two are. The two published outputs (footnote 2: $0.06$; Fig. 1: two reference points outside the lines) therefore cannot both be right; they differ by $\frac{6}{100} - \frac{1}{25} = \frac{1}{50}$, one tail point in fifty.
(iii) [The 12-Tuesday value agrees with the same figure] $k_m \le k_{m'}$ whenever $m \le m'$. If $T \cap W_{25} = \{-14, 7\}$ (the two tail points of the election-hours panel), then $k_{12} = 1$ and $k_{25} = 2$, so $P_{12} = \frac{1}{24}$, which rounds to the printed $0.04$ because $\frac{35}{1000} \le \frac{1}{24} < \frac{45}{1000}$, while $P_{25} = 0.04$ and does not round to $0.06$.
(iv) [Counting the election day itself does not reconcile them] If the election-day point were counted as one more extreme observation among $2m + 1$ points, the 25-Tuesday value would be $\frac{k_{25} + 1}{51} = \frac{3}{51} = \frac{1}{17}$, which rounds to $0.06$ because $\frac{55}{1000} \le \frac{1}{17} < \frac{65}{1000}$; but the 12-Tuesday value would be $\frac{k_{12} + 1}{25} = \frac{2}{25} = 0.08$, which does not round to the printed $0.04$. So with $T \cap W_{25} = \{-14, 7\}$ neither convention gives both printed election-hours values ($0.04$ for 12 Tuesdays and $0.06$ for 25).
: SAP.P038.T1Statement
Theorem: SAP.P038.T1
Statement hash: 67d0396bc062cfd2a75d01721ad57832d9809bd1119bf34e5d8c9deab556f573
Statement definition: SAP.P038.T1Statement
Certificate. 20261103T230038Z
Declaration review: faithful; 2026-11-04T12:48:03Z; binding v2
Evidence scope: Certification checks formal proof objects. Statement fidelity is a model judgment. Author review is separate.
Proof dependencies: Independently extracted
Source and evidence metadata · sap-2026-11-08-assured-release