Assumptions and verification
Claim revision: catalog:6cf1af58b514f757377db327ce1d71ffc467ef8c5ae779f1cc45048ad6a95951
Standing assumptions: The article (SpringerPlus (2016) 5:670, DOI 10.1186/s40064-016-2303-5; six pages; the first page is unnumbered and the others are headed ‘Page 2 of 6’ to ‘Page 6 of 6’, so the printed page number equals the PDF page number) is an empirical report of one randomized field experiment. It states no theorem, proposition, lemma or corollary, displays no formula and gives no proof; its statistical statements are made in running text and in Table 1. Everything quoted from the article below was read from the page images.
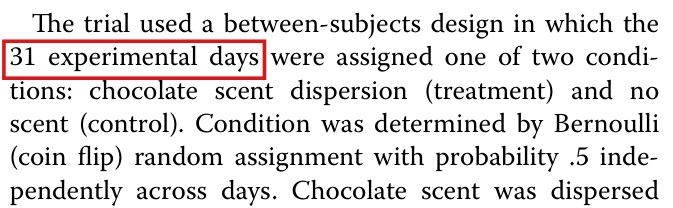
(S1) Design. Methods, p. 2 (PDF p. 2): “We conducted a trial over 31 days in an 800-square-foot independent bookstore in Canada.” p. 3 (PDF p. 3), left column: “The trial used a between-subjects design in which the 31 experimental days were assigned one of two conditions: chocolate scent dispersion (treatment) and no scent (control). Condition was determined by Bernoulli (coin flip) random assignment with probability .5 independently across days.”
(S2) Outcomes. p. 3 (PDF p. 3), left column: “Sales data were recorded in three categories: book sales, café sales (pastries, coffee, and tea), and bulk sales (primarily coffee beans, but also loose tea and spices).”
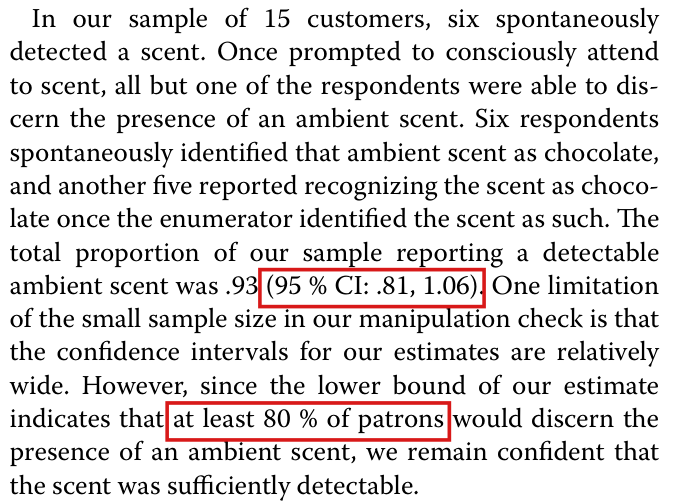
(S3) The manipulation check. p. 3 (PDF p. 3), right column, first paragraph of ‘Results and discussion’: “A manipulation check modeled after Doucé et al. was conducted to evaluate four aspects of the scent: spontaneous detection, prompted detection, spontaneous identification, and recognition of the scent. Fifteen customers were asked to respond to questions about the store atmosphere. To assess spontaneous detection, customers were asked whether they noticed something special in the store atmosphere, with responses coded as 1 if the customer mentioned an ambient scent, 0 otherwise. If the customer did not volunteer that a scent was present, ambient scent was mentioned and the subject was asked whether they could detect a scent now that scent was mentioned. Subjects were then asked if they could identify the scent. Subjects who did not spontaneously identify the scent as chocolate were asked if they recognized the scent as chocolate.” Second paragraph, last sentence: “Our objective was to maintain a detectable ambient scent; we did not seek to eliminate spontaneous detection of the chocolate scent.” The third paragraph is the passage of finding P040-E001 and is transcribed in full in P040-T3. The article names no method for its interval, gives no formula for it and describes no sampling scheme for the fifteen customers.
(S4) The two regression analyses. p. 3 (PDF p. 3), right column, last lines, continuing on p. 4 (PDF p. 4), left column: “We present two regression-based analyses of the trial. The first is a simple ordinary least squares regression of our four outcomes: total sales, bulk sales, café sales, and book sales in Canadian dollars (CAD). This strategy is logically equivalent to taking a simple mean difference between treatment and control. To improve efficiency, the second strategy uses ordinary least squares adjusting for a mean-centered linear time trend as well as mean-centered fixed effects for the day of week, following Lin (2013). In all cases, robust standard errors are used to estimate standard errors, with $p$ values computed under a normal approximation.” p. 4 (PDF p. 4), right column: “In Table 1, we present our estimates of the control means and average treatment effects of the chocolate scent, as computed with ordinary least squares. The direction of the treatment effect on total sales was positive but not statistically significant. None of our estimates of treatment effects are statistically significant at the two-tailed $p$ < .10 level. Our findings are not substantively altered by adjusting for time trends.”
(S5) Table 1, p. 5 (PDF p. 5), as printed. Title: “Table 1 Estimated effects of chocolate scent on bookstore sales”. Columns: “Outcome”, “Unadjusted estimates”, “Adjusted for time trends”. Rows (unadjusted | adjusted). “Total sales”: “Control mean” 575.4 (SE = 34.7) | 593.5 (SE = 30.4); “Treatment effect” 36.6 (SE = 51.6) | 2.7 (SE = 41.7). “Bulk sales”: “Control mean” 72.0 (SE = 13.4) | 71.2 (SE = 16.4); “Treatment effect” 21.8 (SE = 17.5) | 23.2 (SE = 21.2). “Café sales”: “Control mean” 334.7 (SE = 15.2) | 336.5 (SE = 12.6); “Treatment effect” −5.5 (SE = 21.1) | −8.9 (SE = 16.2). “Book sales”: “Control mean” 168.7 (SE = 22.5) | 185.7 (SE = 22.9); “Treatment effect” 20.4 (SE = 32.0) | −11.6 (SE = 32.5). Note under the table: “Estimates of control means and average treatment effects of chocolate scent on total sales, bulk coffee bean/loose tea/spice sales, café sales, and book sales in Canadian dollars. All estimates computed using ordinary least squares regression with robust standard errors. Unadjusted estimates computed without covariates. Adjusted estimates computed using a linear control for the day of experiment and fixed effects for the day of week, all mean-centered”. The table prints no $p$ value; the only $p$ values the article reports are the two of p. 5 (transcribed in P040-T5).
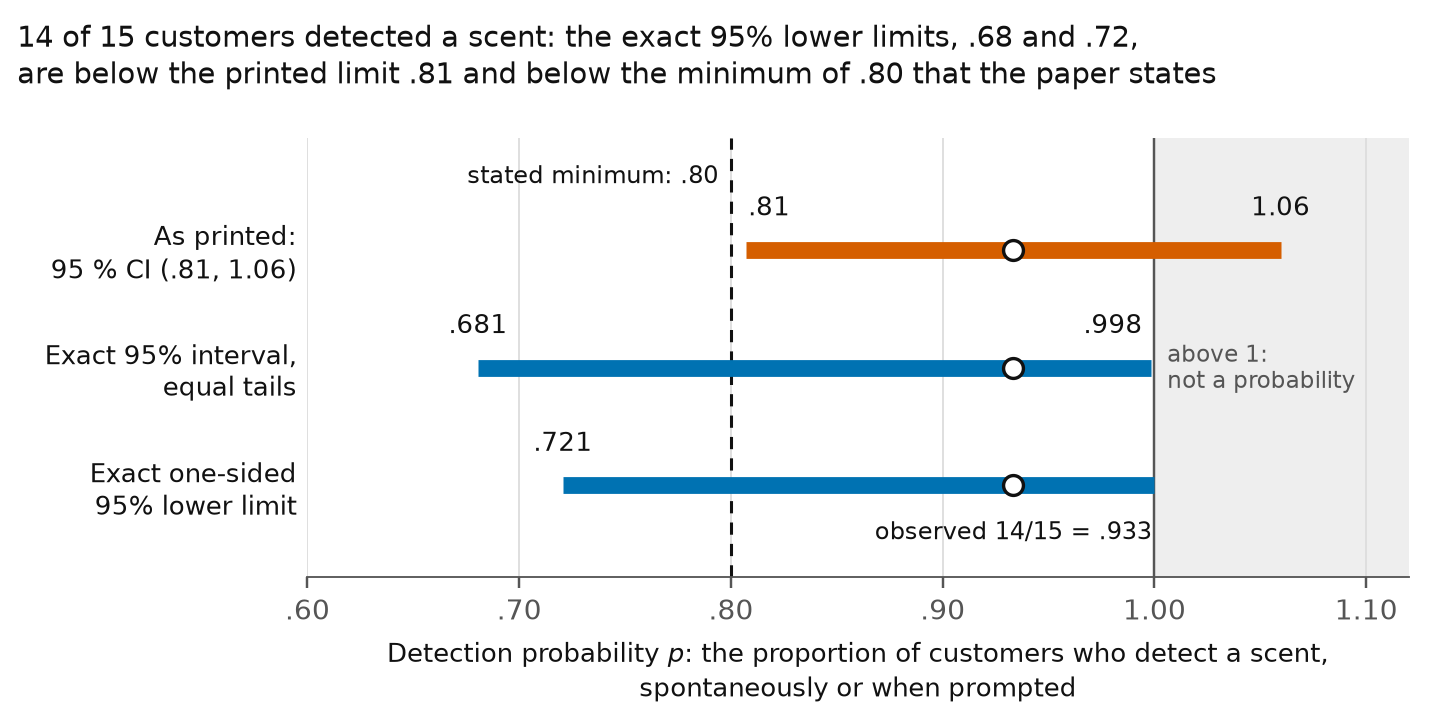
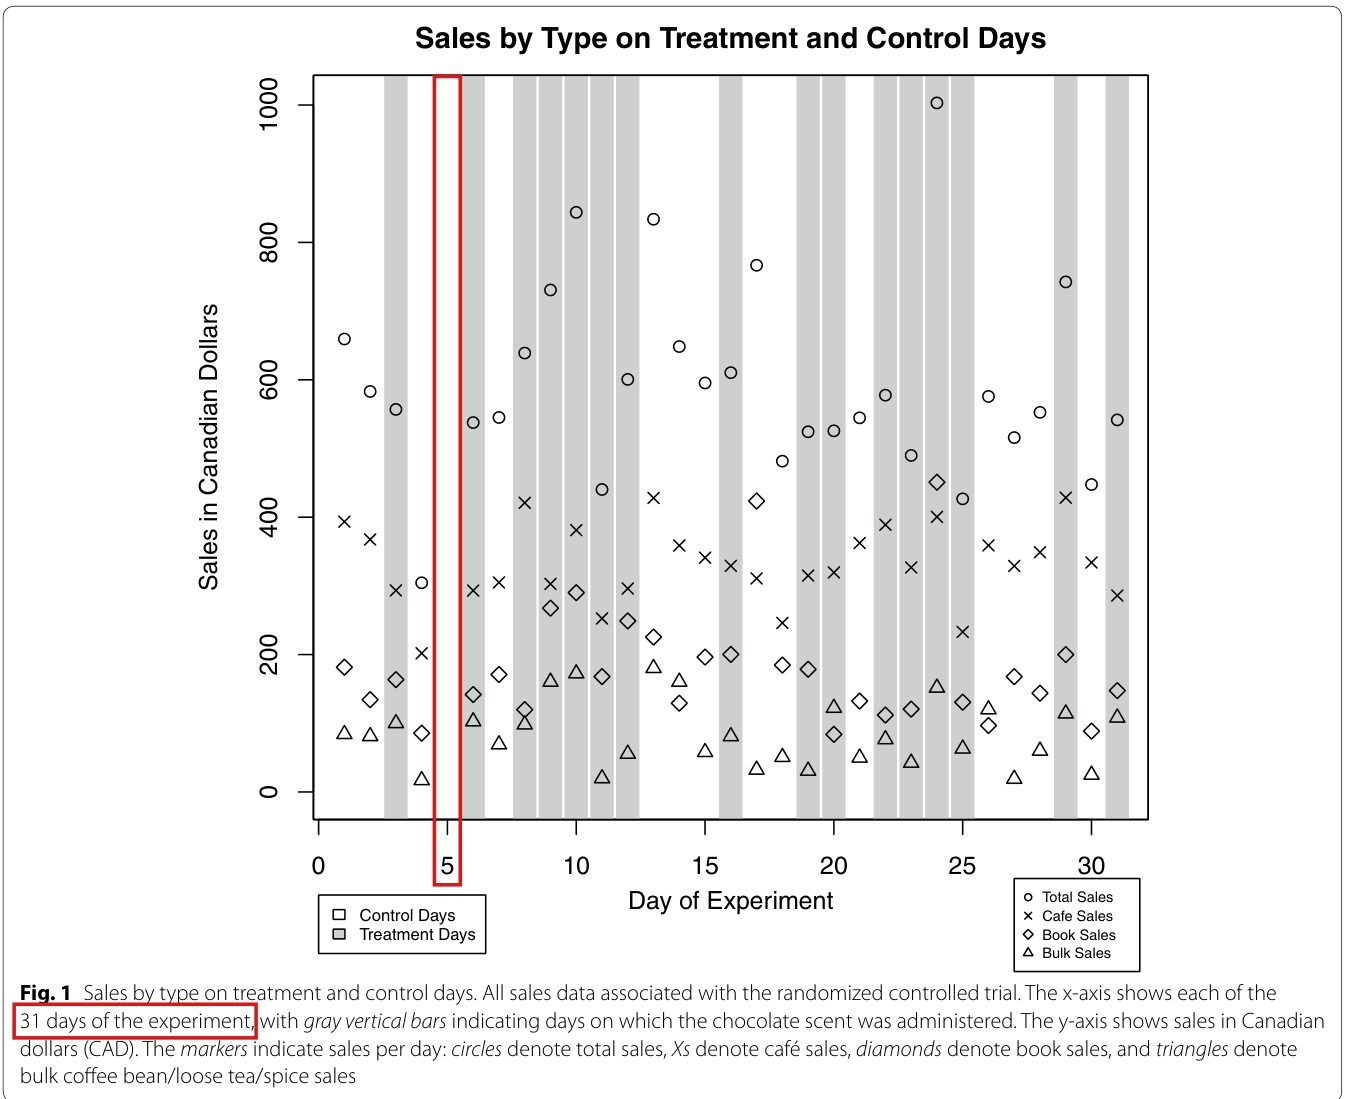
(S6) Replication material; this paragraph is read from the deposited files, not from a page of the article. p. 3 (PDF p. 3), left column: “Full replication data and code are available at the Yale Institution for Social and Policy Studies data archive (http://isps.research.yale.edu/research/data).” The staged archive is staged/code/yale-dataverse-KUKU37-v2.0 (a daily-sales CSV, an R script, the manipulation-check Stata file and its label file). (a) The manipulation-check file has 15 rows and four 0/1 variables with sums notice 6, detect 14, identify 6 and recognize 11; every row with notice = 1 has detect = 1. The ‘detectable ambient scent’ of p. 3 is detection spontaneously or after prompting, the variable detect: 14 of 15. The archive has no code for the interval (.81, 1.06). (b) The sales CSV has $N = 30$ rows, one for each of the days $d$ = 1, 2, 3, 4, 6, 7, …, 31 of August (there is no row for day 5), with Treat = 1 on 16 days and Treat = 0 on 14 days; in every row the total equals book + café + bulk. (c) The R script fits, for each of the four outcomes $y$, lm(y ~ Treat) and lm(y ~ Treat + date2 + dowmat), where date2 is the day number minus its mean and dowmat holds the seven indicators of (day number mod 7), each minus its mean. Its helper robust.se multiplies the heteroskedasticity-robust sandwich covariance by (M/(M−1))·((N−1)/(N−K)) with M = N = 30 singleton clusters and K the model rank, which is the factor N/(N−K) (HC1), and passes the result to lmtest::coeftest without a df argument; coeftest then takes the model's residual degrees of freedom and returns Student-$t$ $p$ values (df = Inf would give normal ones). (d) The rows, as ‘day: Treat, book sales, café sales, bulk sales, total sales’ in CAD (columns Treat, Book Tot., cafee, Beans, Grand Tot. of the CSV; every entry is an exact decimal): 1: 0, 181.71, 393.52, 84.2, 659.43; 2: 0, 134.35, 367.57, 81.15, 583.07; 3: 1, 163.55, 293.35, 100.05, 556.95; 4: 0, 85.65, 201.92, 17.05, 304.62; 6: 1, 141.9, 293.21, 102.71, 537.82; 7: 0, 171, 305.03, 69.19, 545.22; 8: 1, 119.9, 420.96, 98.15, 639.01; 9: 1, 267.6, 302.88, 160.35, 730.83; 10: 1, 290.15, 381.19, 172.51, 843.85; 11: 1, 168, 252.55, 19.8, 440.35; 12: 1, 249.05, 296.13, 55.49, 600.67; 13: 0, 225.55, 427.95, 180.31, 833.81; 14: 0, 129.3, 358.84, 160.32, 648.46; 15: 0, 196.4, 341.07, 57.98, 595.45; 16: 1, 200.25, 329.18, 81.02, 610.45; 17: 0, 423.56, 310.92, 32.35, 766.83; 18: 0, 184.75, 246.09, 50.82, 481.66; 19: 1, 178.65, 314.99, 30.8, 524.44; 20: 1, 83.9, 319.55, 122.36, 525.81; 21: 0, 132.35, 362.47, 49.88, 544.7; 22: 1, 112.05, 389, 76.62, 577.67; 23: 1, 120.65, 326.86, 42.45, 489.96; 24: 1, 450.95, 400.49, 151.7, 1003.14; 25: 1, 130.75, 233, 63.05, 426.8; 26: 0, 96.75, 359, 120.13, 575.88; 27: 0, 167.9, 329, 19.05, 515.95; 28: 0, 143.8, 349, 59.91, 552.71; 29: 1, 200, 428.44, 114.12, 742.56; 30: 0, 88.6, 334.07, 24.97, 447.64; 31: 1, 147.6, 286, 108.12, 541.72.
(S7) Audit notation; not in the paper (from the validators' derivations). Binomial model: $n = 15$; for $p \in [0,1]$ and $E \subseteq \{0,\dots,15\}$, $P_p(E) = \sum_{k \in E} \binom{15}{k} p^k (1-p)^{15-k}$ is the law of the number $X$ of customers who detect a scent when the fifteen responses are independent with a common detection probability $p$; the observed count is $x = 14$. Regression: rows $i = 1,\dots,30$ of the table in (S6)(d), with day $d_i$, assignment $T_i \in \{0,1\}$ and outcome $y_i$ (one of total, bulk, café, book); $N = 30$; $\bar d = \tfrac{1}{30}\sum_i d_i = 491/30$; for $c \in \{0,\dots,6\}$, $n_c = \#\{i : d_i \bmod 7 = c\}$, so $(n_0,\dots,n_6) = (4,5,5,5,4,3,4)$. The unadjusted design $X^{u}$ is the $30 \times 2$ matrix with rows $(1,\ T_i)$. The adjusted design $X^{a}$ is the $30 \times 9$ matrix with rows $\bigl(1,\ T_i,\ d_i - \bar d,\ \mathbf{1}\{d_i \bmod 7 = c\} - n_c/30 \ (c = 0,\dots,5)\bigr)$. (The script's design has a tenth column, the centred indicator of $d \bmod 7 = 6$; the seven centred indicators sum to zero in every row, the ten columns have rank 9 and the same column space as $X^{a}$, and R drops the aliased column. The coefficient on $T$ and its robust variance depend on the other columns only through their span.) For a design $X$ of full column rank $K$ and an outcome $y$: $G = (X^\top X)^{-1}X^\top$, $\hat\beta = Gy$, $e = y - X\hat\beta$, $\hat\beta_T$ is the second coordinate of $\hat\beta$ (the coefficient on $T$), $$v = \frac{N}{N-K}\sum_{i=1}^{N} (G_{2i}\,e_i)^2$$ is the $(2,2)$ entry of the HC1 covariance $\frac{N}{N-K}(X^\top X)^{-1}\bigl(\sum_i e_i^2 x_i x_i^\top\bigr)(X^\top X)^{-1}$ ($x_i^\top$ the $i$-th row of $X$), $q = \hat\beta_T^2/v$ is the squared robust $t$ statistic and $\nu = N - K$ is the residual degrees of freedom (28 for $X^{u}$, 21 for $X^{a}$). Reference distributions: $\Phi$ is the standard normal distribution function and $$p_N(q) = 2\bigl(1 - \Phi(\sqrt q)\bigr) = 1 - \sqrt{2/\pi}\int_0^{\sqrt q} e^{-u^2/2}\,du;$$ for $\nu > 0$, $f_\nu(t) = \frac{\Gamma((\nu+1)/2)}{\sqrt{\nu\pi}\,\Gamma(\nu/2)}\,(1 + t^2/\nu)^{-(\nu+1)/2}$ is the Student-$t$ density with $\nu$ degrees of freedom and $$p_T(q;\nu) = 1 - 2\int_0^{\sqrt q} f_\nu(t)\,dt.$$ Rounding: a real $x$ rounds to the two-decimal number $w$ when $w - \tfrac{1}{200} \le x < w + \tfrac{1}{200}$.
Scope of the list. Four candidates are rated errors (ratings.json): P040-E001 (Moderate), P040-E002, P040-E003 and P040-N008 (Minor). Two of them correct mathematical content and are targets: P040-E001 (the interval (.81, 1.06) is used as a 95% lower bound of 80% that it cannot support: counterexample P040-T1, corrected statement P040-T2, passage as printed P040-T3) and P040-E003 (the two printed $p$ values are Student-$t$ values, not the normal-approximation values the Methods name: counterexample P040-T4, corrected statement P040-T5). P040-E002 (31 experimental days against the 30 analysed daily observations) is a finding about data and reporting whose repair is a clarification, and P040-N008 is bibliographic; neither is a target (see error_findings_not_targeted). P040-N001, N002, N006 and N007 are not confirmed, P040-N003, N004 and N005 are undetermined and P040-N009 is out of scope. None of the seven headline claims (candidates.json, P040-H1 to P040-H7) is a mathematical statement: they are empirical estimates, a description of the design and interpretive remarks, so there is no headline_result target; P040-H6 is the claim touched by P040-E001 and P040-H2 the claim touched by P040-E003.
Effective claim (source TeX): [Printed; p. 4, left column] “In all cases, robust standard errors are used to estimate standard errors, with $p$ values computed under a normal approximation.” [Printed; p. 5, left column] “The direction of the treatment effect on café sales was slightly negative, though not statistically significant (average estimated decrease of 8.9CAD from a control average of 336.5CAD, two-tailed $p$ = .59) and the direction of treatment on bulk coffee bean/loose tea/spice sales was slightly positive, though not statistically significant (average estimated increase of 23.2CAD from a control average of 71.2CAD, two-tailed $p$ = .29).”
[Corrected; Sol's smallest_repair, validated.json, P040-E003, verbatim] “Replace 'under a normal approximation' with 'using a Student-t reference distribution with the model's residual degrees of freedom (28 for the unadjusted regressions and 21 for the adjusted regressions)'. Alternatively retain the normal-reference description, specify df = Inf in coeftest, and change the two printed p-values to .58 and .28.” Under the first branch the Methods sentence reads (prior_correction.corrected_text, status ‘correct’, verbatim): “In all cases, robust standard errors are used to estimate standard errors, with p values computed using a Student-t reference distribution with the model's residual degrees of freedom (28 for the unadjusted regressions and 21 for the adjusted regressions).”
[Mathematical content, with every hypothesis] Notation of (S7); the 30 rows of (S6)(d); for each outcome and each design, $\hat\beta_T$, $v$, $q = \hat\beta_T^2/v$ and $\nu = N - K$ as defined there; $p_T(q;\nu) = 1 - 2\int_0^{\sqrt q} f_\nu(t)\,dt$ is the two-tailed Student-$t$ $p$ value.
(i) Degrees of freedom. $N = 30$. $X^{u}$ has rank $2$, so $\nu = 28$ for each unadjusted regression. The ten columns $1$, $T$, $d - \bar d$ and the seven centred indicators $\mathbf{1}\{d \bmod 7 = c\} - n_c/30$ ($c = 0,\dots,6$) have rank $9$: the seven centred indicators sum to zero in every row, and the nine columns of $X^{a}$ are linearly independent. So $\nu = 21$ for each adjusted regression.
(ii) The two printed values. With $q_{\text{café}}$ and $q_{\text{bulk}}$ the exact squared statistics of the adjusted regressions (P040-T4 (B1), (B2)) and $f_{21}(t) = \frac{4^{10}}{\pi\binom{20}{10}\sqrt{21}}\,(1 + t^2/21)^{-11}$: $$0.58779 < p_T(q_{\text{café}};\,21) < 0.58780,$$ which lies strictly inside $(0.585,\ 0.595)$ and rounds to the printed $.59$; and $$0.28766 < p_T(q_{\text{bulk}};\,21) < 0.28767,$$ which lies strictly inside $(0.285,\ 0.295)$ and rounds to the printed $.29$.
(iii) The significance statement under the corrected reference. For the eight regressions of Table 1 the exact squared statistics $q$ are: unadjusted total $263679812816672/522999591200175$ ($\approx 0.504168$); unadjusted bulk $23273498735648/15141092298015$ ($\approx 1.537108$); unadjusted café $1492978176032/21949506186495$ ($\approx 0.068019$); unadjusted book $9067019347232/22381571766655$ ($\approx 0.405111$); adjusted total $1200277903320876335774/280628848000463708694463$ ($\approx 0.004277$); adjusted bulk $12396039010057804992800/10415886991743115636339$ ($\approx 1.190109$); adjusted café $12767624825803755635000/42131842162249950707521$ ($\approx 0.303040$); adjusted book $3084161273413343448962/24391999904970062376441$ ($\approx 0.126442$). Each is at most the unadjusted-bulk value, which is below $8/5$. For each of the eight, $p_T(q;\nu) > 1/10$ with its own $\nu$ ($28$ unadjusted, $21$ adjusted), and also $p_N(q) > 1/10$. The smallest values are those of unadjusted bulk sales: $$0.22533 < p_T(q;\,28) < 0.22534 \qquad\text{and}\qquad 0.21504 < p_N(q) < 0.21505.$$ So the sentence of p. 4, ‘None of our estimates of treatment effects are statistically significant at the two-tailed $p$ < .10 level’, holds under the corrected Student-$t$ reference and under the normal reference alike.
(iv) Alternative branch of the repair. If the normal-reference description is kept, the two printed values become $.58$ and $.28$: this is P040-T4 (B3), (B4).
What the corrected statement does not assert: that the robust $t$ statistic has an exact Student-$t$ distribution under the null hypothesis, or that either reference gives a test of exact size; Student-$t$ is named as the reference distribution that was used.
: SAP.P040.T5Statement
Theorem: SAP.P040.T5
Statement hash: 158ff84063296d14785075450abea9aac1f394bb0c41c9de285aec4db79ee4cf
Statement definition: SAP.P040.T5Statement
Certificate. 20261104T160517Z
Declaration review: faithful; 2026-11-04T16:25:53Z; binding v2
Evidence scope: Certification checks formal proof objects. Statement fidelity is a model judgment. Author review is separate.
Proof dependencies: Independently extracted
Manifest annotation reconciliation: Effective use follows the source-bound dependency observation; original annotations are retained in the crosswalk.
AronowAudit.P040.corrected_student_reference_rounding: observed used
AronowAudit.P040.recorded_day_summary: observed used
AronowAudit.P040.reference_p_at_max_21: observed used
AronowAudit.P040.reference_p_at_max_28: observed used
AronowAudit.P040.student21_decimal_certificate: observed used
AronowAudit.P040.student21_kernel_bracket: observed used
AronowAudit.P040.student21_p_enclosure: observed used
AronowAudit.P040.student21_polynomial_integral: observed used
AronowAudit.P040.student28_decimal_certificate: observed used
AronowAudit.P040.student28_density_identity: observed used
AronowAudit.P040.student28_kernel_bracket: observed used
AronowAudit.P040.student28_kernel_upper: observed used
AronowAudit.P040.student28_p_enclosure: observed used
AronowAudit.P040.student28_polynomial_integral: observed used
AronowAudit.P040.student28_square_certificate_10: observed used
AronowAudit.P040.student28_square_certificate_11: observed used
AronowAudit.P040.student28_taylor_integral: observed used
AronowAudit.P040.student28_upper_polynomial_nonneg: observed used
AronowAudit.P040.student_density_regular: observed used
AronowAudit.P040.student_reference_antitone: observed used
AronowAudit.P040.table_effects_not_significant: observed used
Source and evidence metadata · sap-2026-11-08-assured-release

My comment and the history of this entry
Suggested classification: Minor error.
My position My comment above; I suggested a Minor error.
The models’ position For the reconstructed nominal 95% Wald interval, with 15 independent responses and a common detection probability of .80, two-sided coverage is only about 81.5%. The conventional reading of its lower endpoint was accepted, but the paper’s explicit assurance of at least 80% rests on a seriously inaccurate small-sample approximation: Moderate.