P042-E001 Moderate
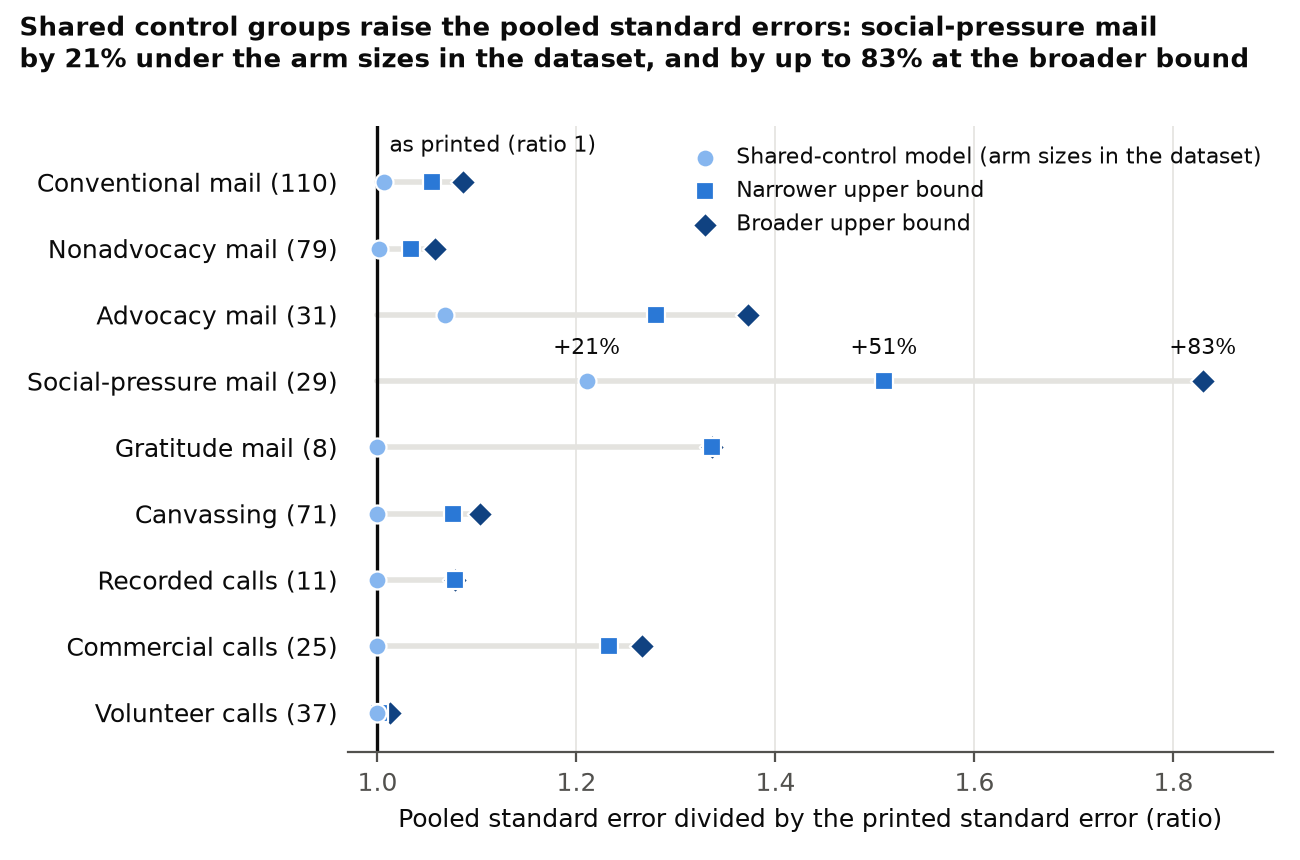
The pooled 95% intervals on pp. 31–33 treat all pooled contrasts as independent, although several are arms of one experiment that share a control group; the variance of each pooled estimate should include the covariances between such contrasts, and under the standard shared-control model with the arm sizes in the replication dataset the standard error of the social-pressure estimate is 21% larger than the one behind the printed interval.
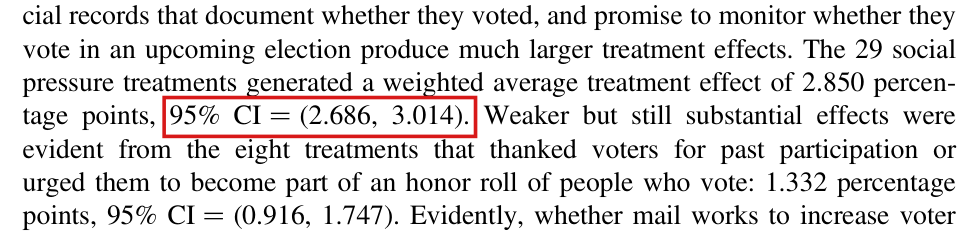
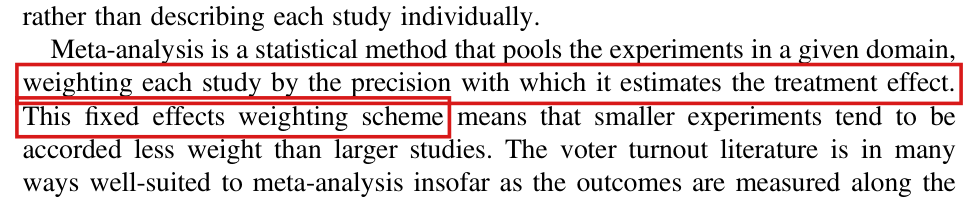
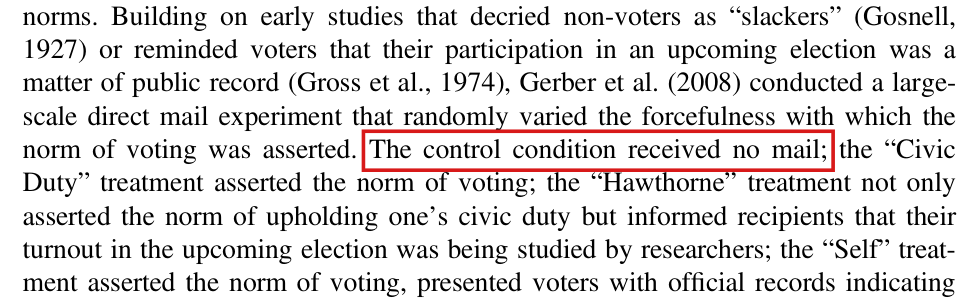
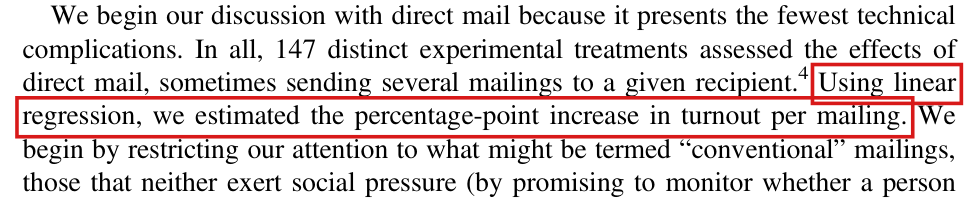
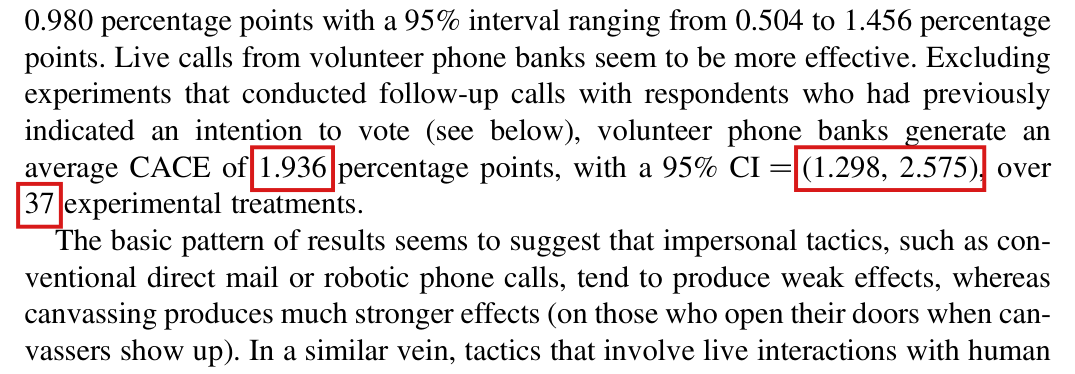
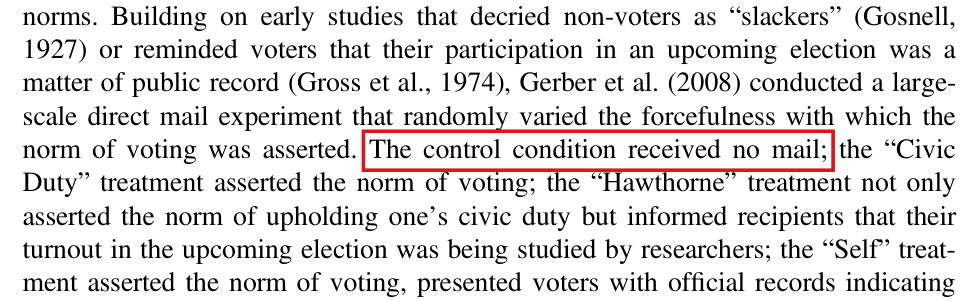
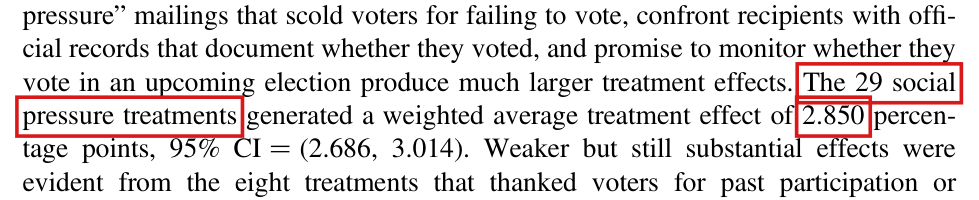
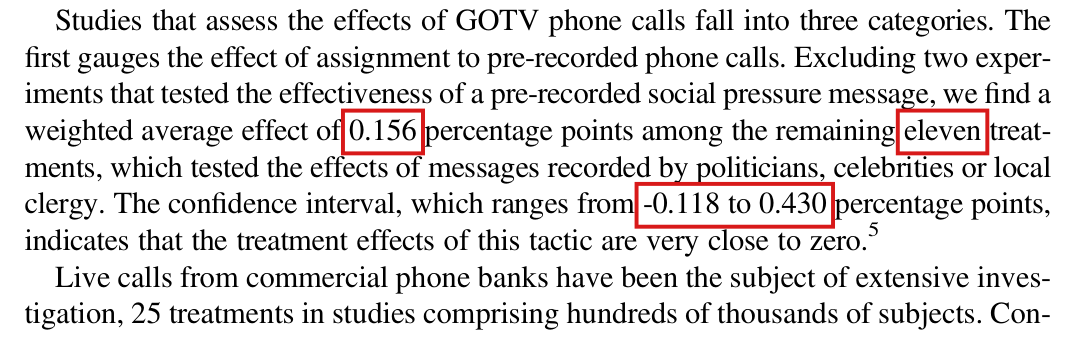
pp. 31–33 (PDF pp. 7–9): the weighting scheme described on p. 31, second paragraph, and every pooled 95% interval that follows, shown here for the social-pressure interval on p. 32 (PDF p. 8), first paragraph. The shared control group is described on p. 36 (PDF p. 12).
See also under Formal statements (Lean): P042-T1, P042-T2, P042-T5
As printed
p. 31: “Meta-analysis is a statistical method that pools the experiments in a given domain, weighting each study by the precision with which it estimates the treatment effect. This fixed effects weighting scheme means that smaller experiments tend to be accorded less weight than larger studies.”
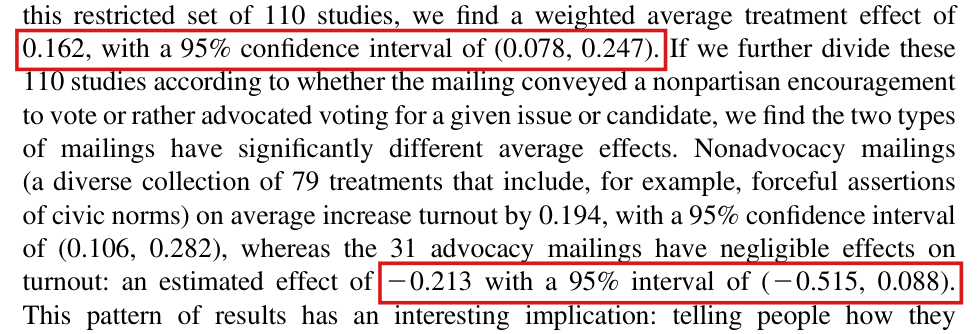
p. 32: “The 29 social pressure treatments generated a weighted average treatment effect of 2.850 percentage points, 95% CI .”
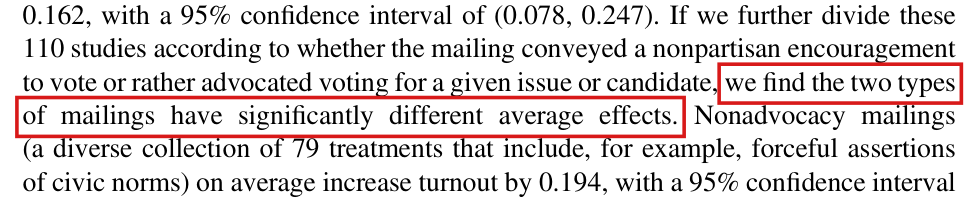
p. 31: “we find the two types of mailings have significantly different average effects.”
The problem
The replication program computes each pooled estimate as a weighted average of the contrasts , with weights proportional to , where is the standard error of . It takes the variance of this average to be . That is the variance only if the weighted covariance terms sum to zero, as they do for uncorrelated contrasts. Several pooled contrasts are arms of one experiment that share a control group. The Hawthorne, Self and Neighbors mailings of Gerber et al. (2008), which p. 36 describes with one control condition, are three of the 29 social-pressure treatments. Four Kentucky treatments of Mann (2010) share a control group of 19,561 people and hold 32% of the weight of that pool. Two contrasts with a common control group both contain the sampling error of the control mean. For unscaled differences in means under independent sampling, their covariance is the variance of that mean, which is positive. The printed intervals omit these terms. How much the intervals' widths should change for the actual experiments cannot be recovered from the dataset, which gives marginal standard errors but no covariances; the size of the omission can be computed under stated models, as below.
Evidence an exact counterexample
The evidence is a derivation, two exact counterexamples to the program’s variance formula, and a recalculation from the replication files.
Reproduction. The pooling commands of the replication program receive an effect and its standard error for each treatment and no covariance. With the variance , all nine estimates and intervals on pp. 31–33 reproduce to the printed precision. For the social-pressure pool the standard error is 0.0838.
Derivation. Let and , so that . For fixed weights, I have
With , the first sum equals . Let , and be the mean outcomes of two treatment groups and of their common control group. If the three means are uncorrelated, then
Counterexamples. Consider six voters whose turnout is whatever they are sent, and assign two of them at random to each of a control group and two mail groups. Both true treatment effects are zero. Enumerating the 90 equally likely assignments shows that each contrast has variance and that the two contrasts have covariance . Their average then has variance , and the program’s formula gives . In the second example, each voter in three independent groups of 100 votes independently with probability . Each of the two contrasts has variance , and their covariance is . Their average has variance , where the program’s formula gives . By exact enumeration, the nominal 95% normal interval built from covers the true value zero with probability 0.8887. The examples show that the program’s formula can fail for contrasts with a common control group. They do not measure the coverage of the article’s intervals.
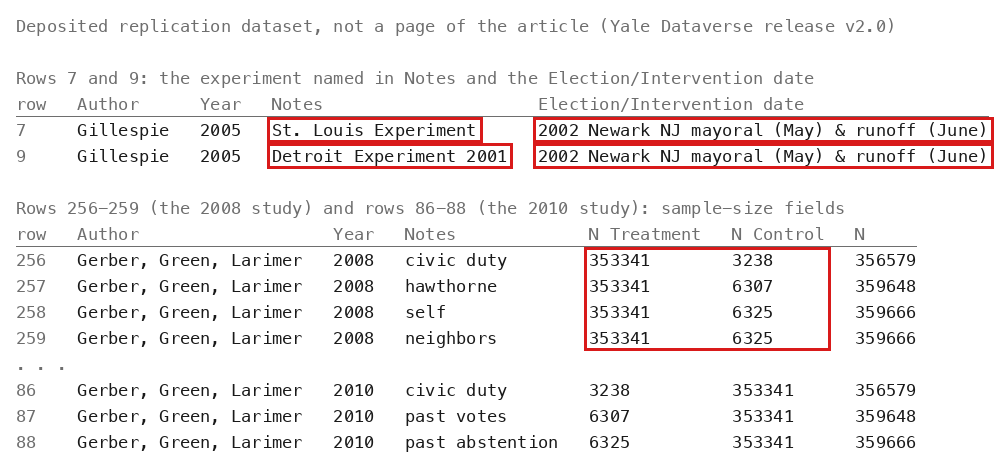
Recalculation. The dataset records the arm sizes for some groups of contrasts with a common control group. The groups with at least two contrasts in the social-pressure pool hold 50.3% of its weight, and the four Kentucky treatments hold 32.4%. I use the shared-control model’s correlations with the stored standard errors for these groups and take all other contrasts to be independent. For the social-pressure estimate, I obtain a standard error of 0.1014, which is 21% above 0.0838. With the Kentucky group alone, the standard error is 0.0997, which is 19% above. The three mailings of Gerber et al. (2008) hold 23.4% of the weight, each with . If their three covariances equal , then they add to the variance. The dataset does not determine , since its sample-size fields for these rows cannot be used (P042-E003), and the model treats the three contrasts as independent.
I also computed two upper bounds. At the narrower bound, each group of contrasts that appear to come from one experiment, but lack sizes, has the largest covariance that their standard errors allow, . The broader bound also allows overlaps that the dataset leaves unresolved, among them a control group common to all seven Kentucky rows. At both bounds, different groups are independent. Neither bound is the covariance of the actual experiments.
| Pool | As printed | Shared-control model | Narrower bound | Broader bound |
|---|---|---|---|---|
| Conventional mail (110) | ||||
| Nonadvocacy mail (79) | ||||
| Advocacy mail (31) | ||||
| Social-pressure mail (29) | ||||
| Gratitude mail (8) | ||||
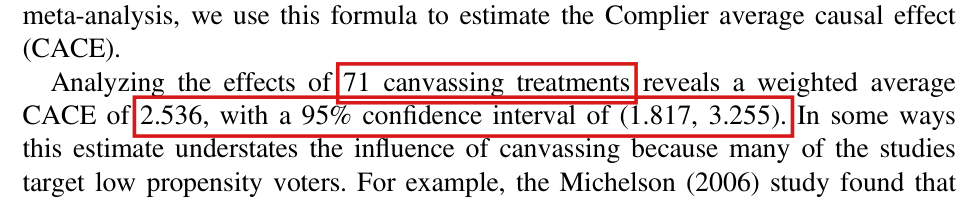
| Canvassing (71) | ||||
| Recorded calls (11) | ||||
| Commercial calls (25) | ||||
| Volunteer calls (37) |
The difference between the nonadvocacy and advocacy estimates is 0.407. Its variance is , where in the first pool and in the second. No group of contrasts in the model or the bounds joins the two pools.
| Covariance | Standard error | 95% interval | ||
|---|---|---|---|---|
| Independence, as in the article | 0.160 | 2.54 | 0.011 | |
| Shared-control model | 0.170 | 2.39 | 0.017 | |
| Narrower bound | 0.202 | 2.01 | 0.044 | |
| Broader bound | 0.217 | 1.88 | 0.060 |
Both tables use the estimates as stored. I did not repeat the calculation with the estimates corrected in P042-N003, P042-N005 and P042-N006.
What survives
The nine pooled estimates, their counts and their ordering do not depend on the variance and are unchanged. Under the model and at both bounds, each of the nine intervals keeps its position relative to zero. The social-pressure and gratitude normal intervals stay above zero for every covariance matrix that is compatible with the stored standard errors, with minimum lower endpoints of 2.087 and 0.257 to three decimal places. The difference between nonadvocacy and advocacy mail stays significant at the 5% level under the model and at the narrower bound. At the broader bound it does not (), which shows that the printed statement could fail and not that it does. What changes is the stated precision: the printed intervals use the independence-based variance and a normal approximation.
Corrected
Let a pool consist of contrasts with standard errors and covariance matrix , so that , and let the weights be treated as fixed. The pooled estimate has variance
The printed intervals use the first term alone. It is the full variance only if the second term vanishes, for instance if no two contrasts of the pool are correlated. Approximate 95% coverage also depends on the validity of the normal approximation.
Suppose that and compare treatment groups of and subjects with a common control group of subjects, and that subjects' outcomes are independent with the same variance in all three groups. Then
I refer to these assumptions as the shared-control model. The correlation is the same if each contrast is a fixed positive multiple of the difference in means, as for an effect per mailing. For the difference between the nonadvocacy and advocacy pooled estimates the variance is , with in the first pool and in the second.
The sentence on p. 32 should read: “The 29 social pressure treatments generated a weighted average treatment effect of 2.850 percentage points. If the 29 contrasts are treated as independent, the nominal 95% CI is (2.686, 3.014); using the shared-control model’s correlations for the arm sizes in the replication dataset with the stored standard errors, it is (2.651, 3.049).” The other eight intervals need the same qualification, with the values in the table above. On p. 31, the two types of mailings have significantly different average effects under the independence-based normal approximation (). An interval for the actual experiments requires the covariance of the contrasts of each experiment, which the replication dataset does not contain.