P043-E007 Moderate
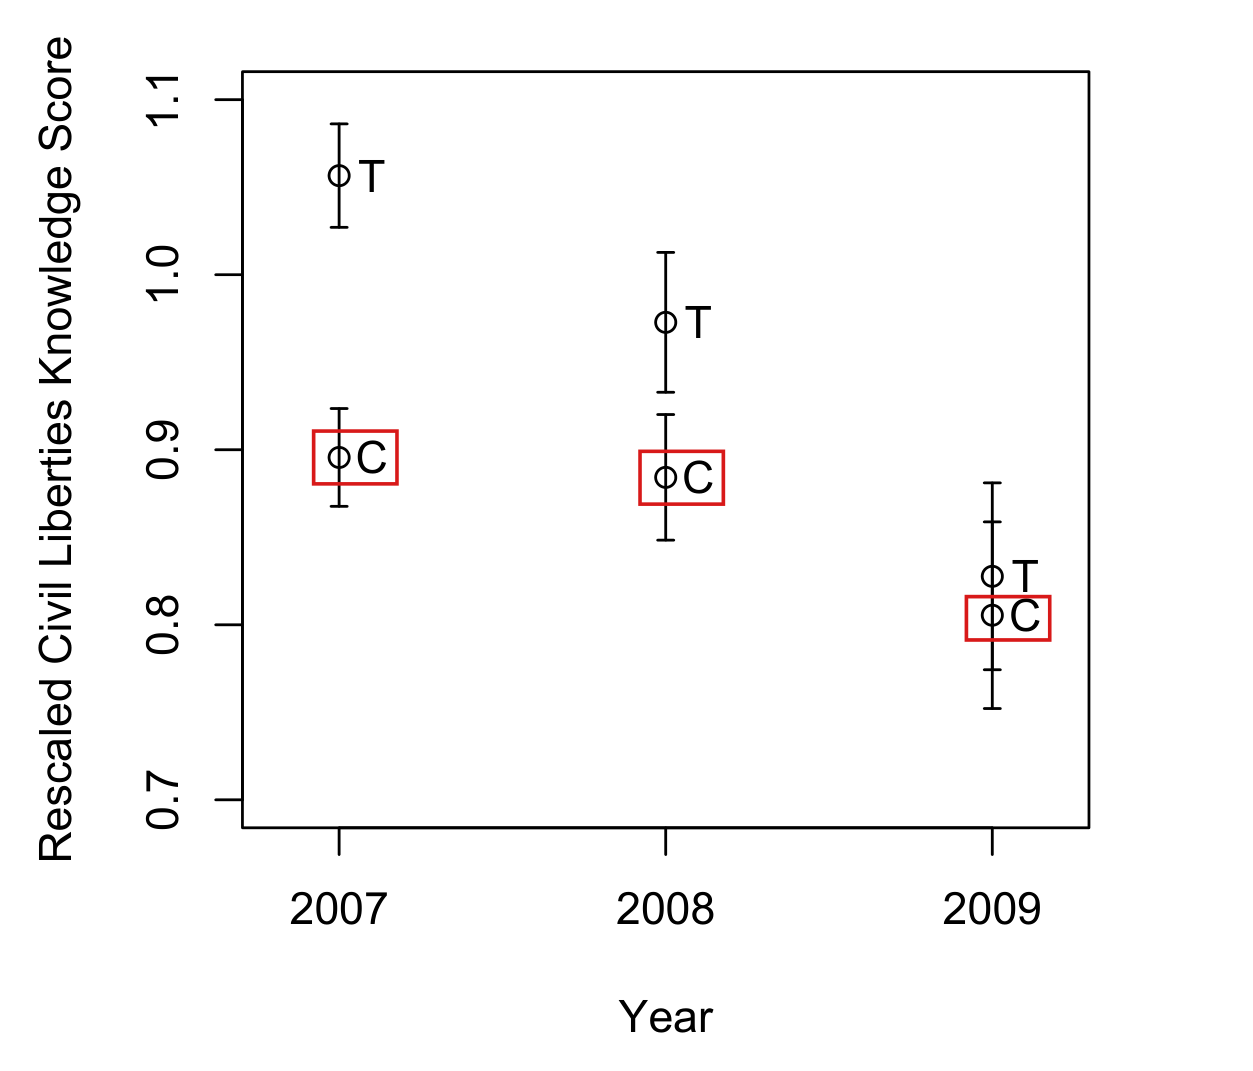
After the paper’s normalization, the control group means are 0.896, 0.884 and 0.805 in 2007, 2008 and 2009: the description “essentially unchanged” omits a decline of about 10% by the third wave, while the gap between the treatment and control means shrinks from 0.161 to 0.089 to 0.022.
p. 473 (PDF p. 11), right column, sentence beginning “After correcting for the changing difficulty of the items over time”; the figure of rescaled knowledge scores, p. 11 of the online appendix, and Table A4, p. 8 of the online appendix
I disputed this classification, but as a rule, deferred to the models’ final judgment: see my comment and the history of this entry.
As printed
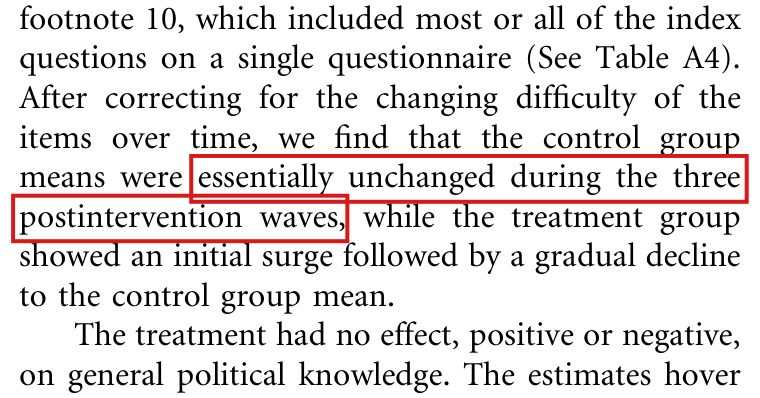
After correcting for the changing difficulty of the items over time, we find that the control group means were essentially unchanged during the three postintervention waves, while the treatment group showed an initial surge followed by a gradual decline to the control group mean.
The problem
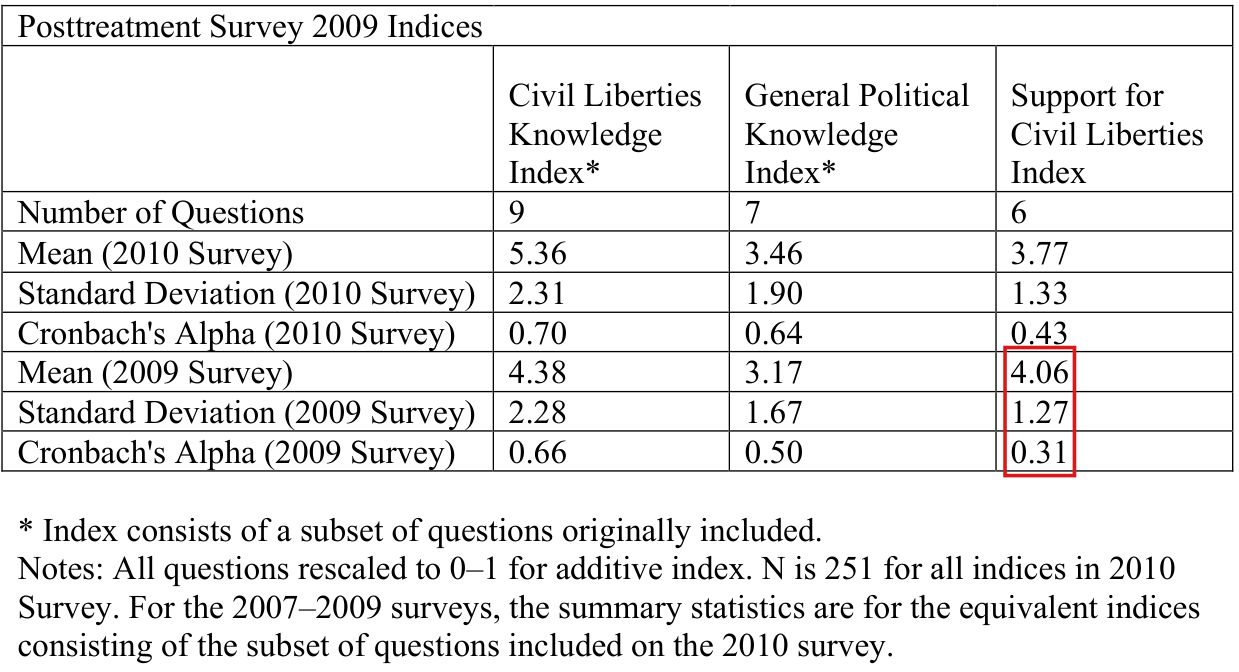
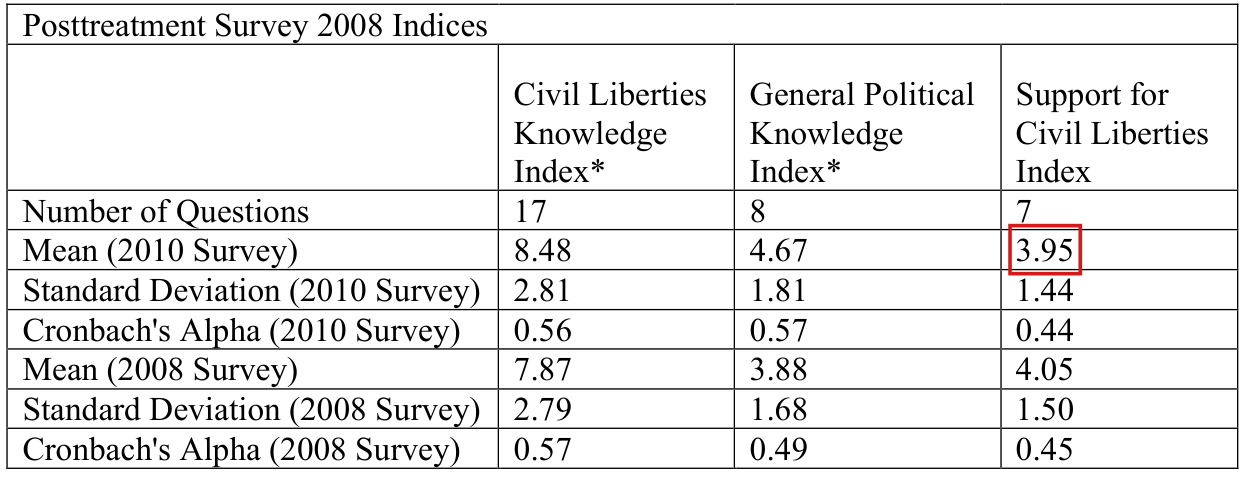
The sentence summarizes the unnumbered figure on p. 11 of the online appendix. The three survey waves used different questions to measure knowledge. For each wave, the figure takes the equivalent index of Table A4, which consists of the questions of that wave that were repeated on the 2010 survey. It divides this index by the mean of the same index on the 2010 survey. After this normalization, the control group means are 0.896 in 2007, 0.884 in 2008 and 0.805 in 2009. The control mean is nearly flat between the first two waves and then falls. Its decline from 2007 to 2009 is 0.090, which is 10.06% of its 2007 value and about 56% of the initial gap of 0.161 between the treatment and control means. The description “essentially unchanged” fits the first two waves, and the sentence extends it to the third, where it does not fit. The sentence then presents the treatment group as falling toward a control level that stayed fixed. The figure and the data show that both means fell and that the gap between them shrank. The paper states no tolerance for “essentially”, so there is no numerical criterion to refute, and I do not read the phrase as exact equality. The error is one of description: the sentence reports a stable control baseline and omits a decline of this size, which the paper’s own figure displays. The decline is a difference of observed means. It does not show that students forgot, that the normalization failed, or that a population mean changed.
Evidence a recalculation from the source
The evidence is a recalculation from the public replication data in exact arithmetic, together with a check of the appendix figure and of Table A4. Following the scoring rules of the Stata script in the replication files, I rebuilt the equivalent index of each wave (13, 17 and 9 questions) and the matching index on the 2010 survey. Each index is available for 251 of the 254 respondents in the public file of the 2010 survey, and the three totals over these respondents are , and . Let be the total of the equivalent index over the students of group in the survey of year . The mean plotted in the figure is
For the control group in 2007, I obtain , which is 0.8956 to four decimals. A second calculation, written independently from the same files, gives the same fractions.
| Students | Year | Control | Control mean | Treatment | Treatment mean | Gap |
|---|---|---|---|---|---|---|
| All in the wave | 2007 | 514 | 0.8956 | 531 | 1.0566 | 0.1610 |
| All in the wave | 2008 | 296 | 0.8842 | 295 | 0.9728 | 0.0886 |
| All in the wave | 2009 | 253 | 0.8055 | 255 | 0.8277 | 0.0222 |
| The same 387 | 2007 | 200 | 0.9215 | 187 | 1.0772 | 0.1557 |
| The same 387 | 2008 | 200 | 0.8958 | 187 | 0.9682 | 0.0724 |
| The same 387 | 2009 | 200 | 0.8192 | 187 | 0.8632 | 0.0440 |
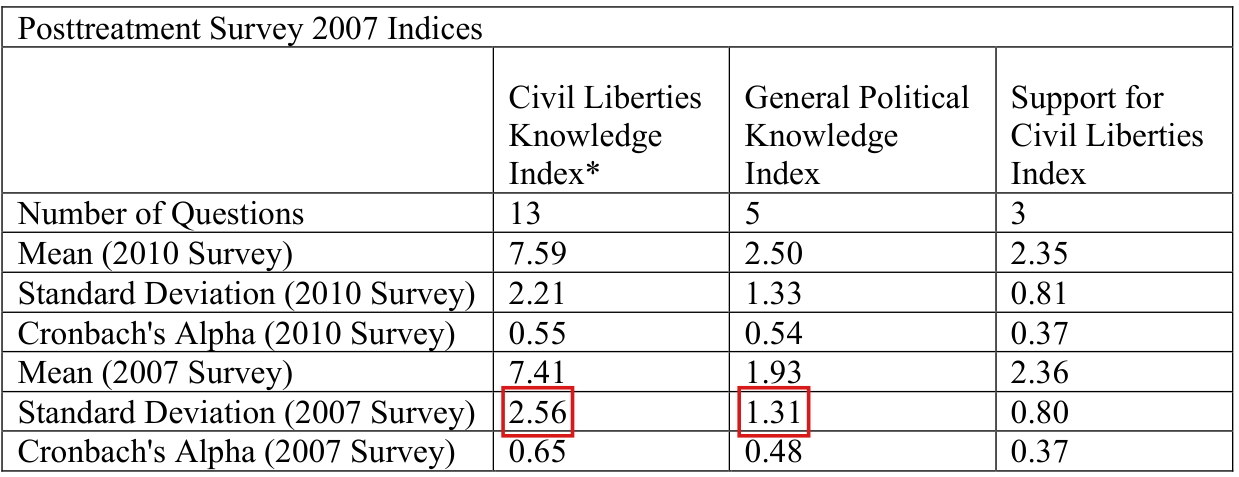
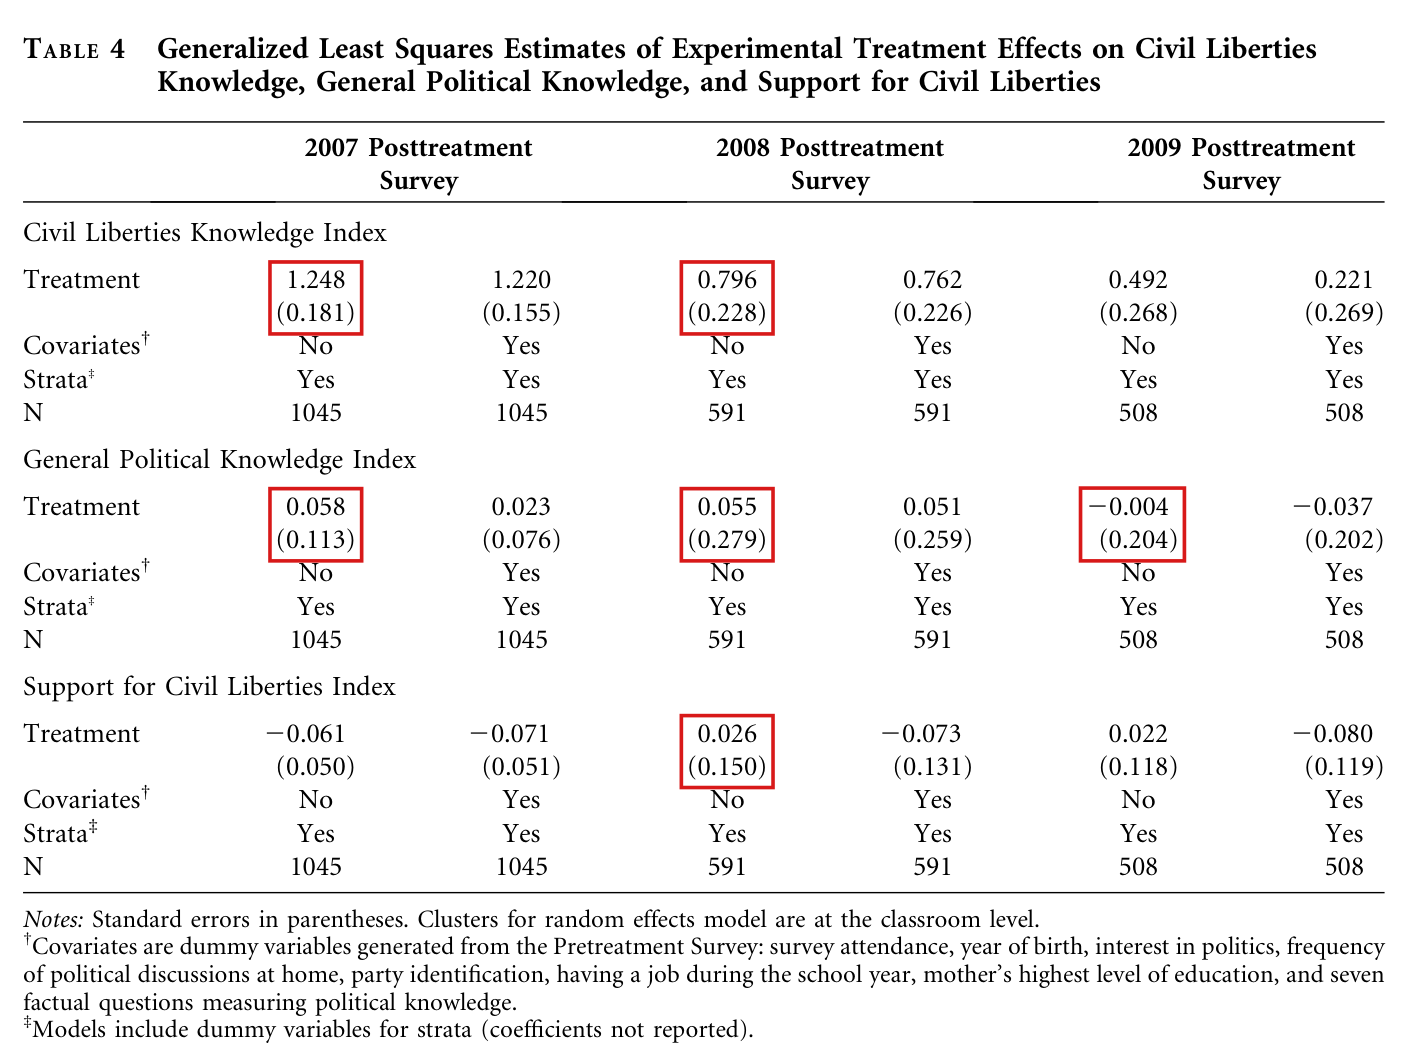
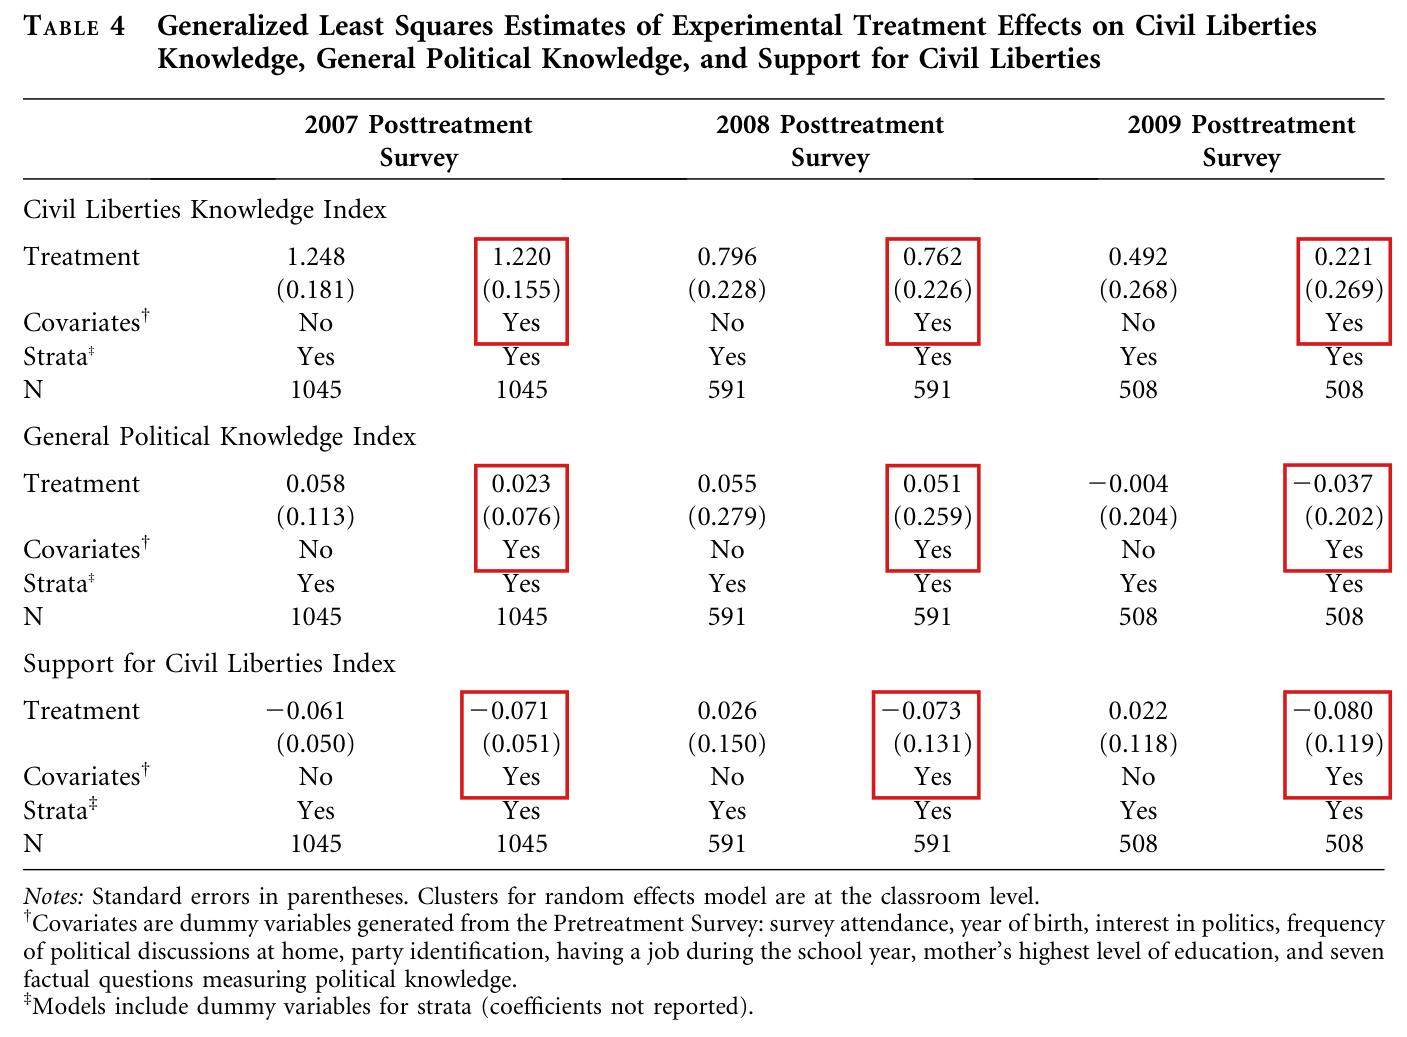
The public files are a release edited for privacy; the numbers of students in the three waves (1045, 591 and 508) agree with Table 4. The 2010 means are 7.59, 8.48 and 5.36 to two decimals, and the pooled means of the three waves are 7.41, 7.87 and 4.38; these six values agree with Table A4. The points of the appendix figure lie at the values of the first three rows: about 0.90, 0.88 and 0.81 for the control group, and about 1.06, 0.97 and 0.83 for the treatment group.
The control mean falls by 0.0114 from 2007 to 2008 and by 0.0901 from 2007 to 2009. Among the 200 control students whose index is available in all three waves, the decline from 2007 to 2009 is 0.1022, which is 11.09% of the 2007 value. Holding the set of students fixed therefore does not remove the decline. The gap is positive and decreasing in both sets of students. The treatment mean falls by 0.2289 from 2007 to 2009. Writing for the gap, I have
and the two terms on the right are and . The identity relates observed means and has no causal interpretation. I ran no test of change over time that accounts for repeated students, classrooms and the uncertainty of the 2010 means. I do not use the confidence bars of the figure as such a test.
What survives
This correction leaves the appendix figure, its means and Table A4 unchanged. The decline of the treatment advantage stands: the gap between the treatment and control means is positive and shrinks from 0.161 to 0.089 to 0.022. Each regression of Table 4 and of the appendix is fitted within one wave and does not assume a constant control mean across waves. The sentence is not an input to those estimates. I have not recalculated those estimates here. What changes is the description of the two trajectories. The control baseline was not stable after the normalization, and the data do not support describing the decline of the treatment group as a fall toward a fixed control level.
Corrected
After applying this normalization, the observed control-group means were approximately 0.896, 0.884 and 0.805 in 2007, 2008 and 2009, respectively. The treatment-control gap shrank from approximately 0.161 to 0.089 to 0.022 over these waves.
This wording replaces the whole sentence. A shorter repair keeps the sentence and replaces only its clause on the control group, which then reads “the observed rescaled control-group means declined, particularly in the third postintervention wave”. Neither wording attributes the decline of the control means to forgetting or to a failure of the normalization.







My comment and the history of this entry
Suggested classification: Minor error.
My position My comment above; I suggested a Minor error.
The models’ position The control group’s mean falls by about 0.09, around 10% of its starting level and 56% of the initial gap between the groups, so describing it as essentially unchanged materially changes how a reader understands the trajectories: Moderate.